Environmental Engineering Reference
In-Depth Information
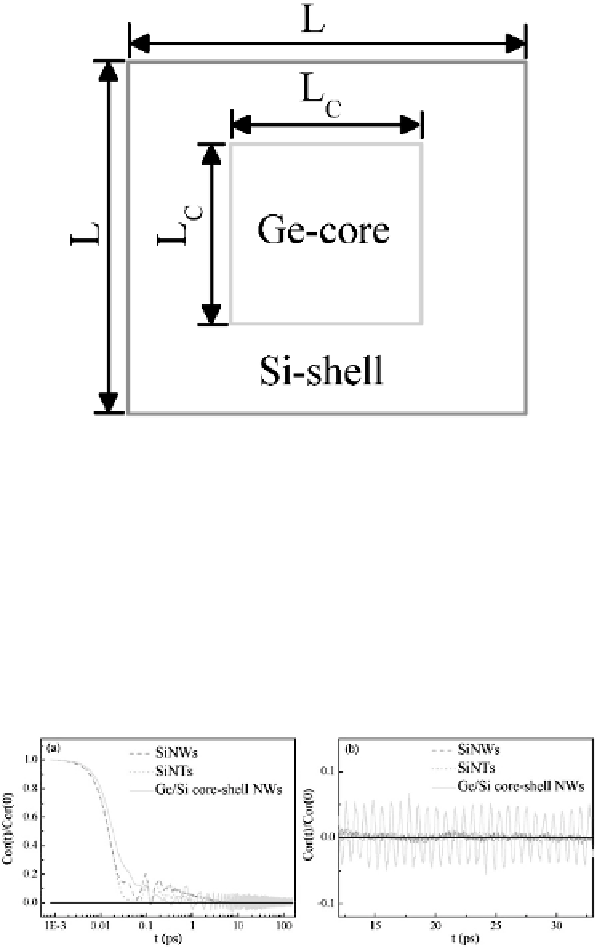
Figure 1.23
Cross-sectional view of Ge/Si core-shell NWs. The cross-
sections of both core and shell regions are square, with
L
c
and
L
denoting
the side length of core and shell regions, respectively.
Figure 1.24 shows the typical time dependence of normalized
HCACF in a 16
×
5
×
5 super cell at 300 K for Ge/Si coreshell
NWs with a given coreshell ratio (
L
c
/
L
=
0.65). For comparison,
the HCACF for SiNWs and SiNTs is also shown. For both SiNWs
and SiNTs, there is a very rapid decay of HCACF at the beginning,
followed by a long-time tail with a much slower decay. When time
Figure 1.24
Time dependence of normalized HCACF. (a) Normalized
HCACF for SiNWs, SiNTs, and Ge/Si core-shell NWs with
L
c
/
L
=
0.65. (b)
Long-timeregion of (a).