Environmental Engineering Reference
In-Depth Information
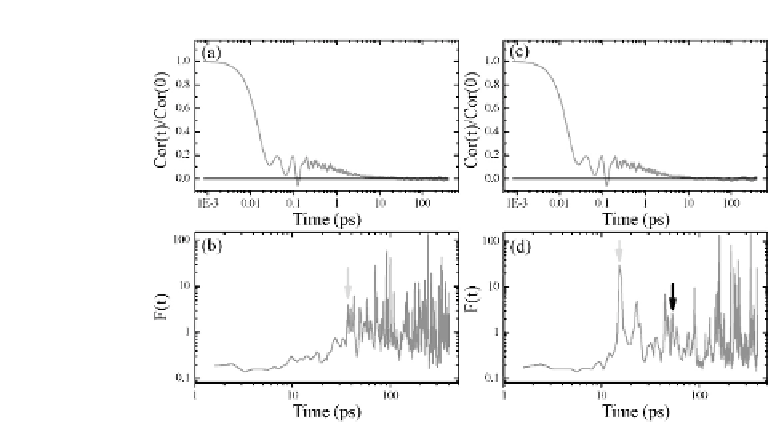
Figure 1.19
Time dependence of normalized HCACF Cor(t)/Cor(0) (curve
inaandc)anditsrelativefluctuationF(t)(curveinbandd)forthesametwo
realizationsshowinFig.1.18.Thelightanddarkarrowspinpointthecut-off
timeestimatedbyfirstavalancheandfirstdip,respectively.Thestraightline
(a,c) draws the zero-axis for reference.
σ
where
and E denote the standard deviation and mean value of
HCACF in the timeinterval (
t
,
t
+
δ
), respectively.
Figure1.19a,cshowsthetimedependenceofHCACFforthesame
two realizations shown in Fig. 1.18. HCACF exhibits the typical two-
stage decaying characteristics of HCACF, and decays to zero in the
long-time region. As shown in Fig. 1.19b,d, before a critical time,
the relative fluctuation of HCACF
F
(
t
) maintains a small value (e.g.,
less than 1) and does not change significantly. This indicates that
HCACF is still reliable as it shows no large fluctuation. After the
critical time,
F
(
t
) suddenly jumps to a large value, and changes
value drastically over time, which is a typical signature of the
randomnoise.ThisindicatesthatHCACFhasbeencontaminatedand
dominated by computational error, and thus is no longer reliable.
Therefore, Chen
et al.
[65] define this critical time (when
F
(
t
)
becomes larger than 1) as the cut-off time, as marked by the green
arrow in Fig. 1.18 and 1.19, and refer this way to estimate
τ
c
as
“first avalanche” (FA) method. The essence of FA is to only take
intoaccountthosecontributionsfromHCACF,whichisbefore
τ
c
and