Environmental Engineering Reference
In-Depth Information
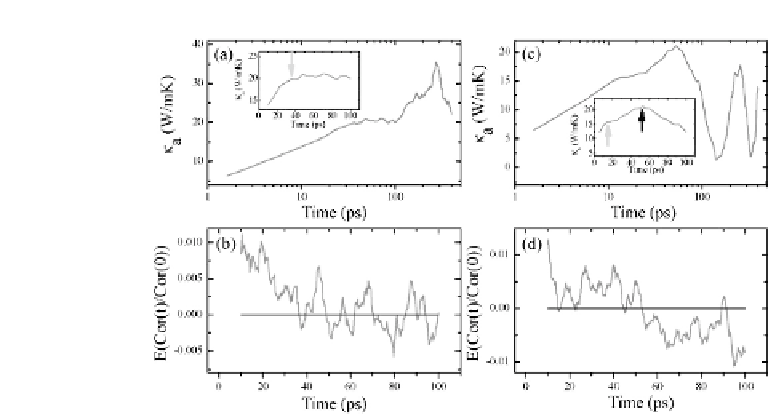
Figure 1.18
Accumulativethermalconductivity(curveinaandc)andmean
value of normalized HCACF (curve in b and d) for the crystalline Silicon at
1000K.Hereweshowtwotypicalrealizationsina4
4supercell.The
insetzoomsinfortheshort-timeregion.Thelightanddarkarrowspinpoint
the cut-off time estimated by first avalanche and first dip, respectively. The
straight line (b,d) draws the zero-axis forreference.
×
4
×
first reaches a plateau (Fig. 1.18a). This is the ideal case that the
average of HCACF fluctuates around zero in a relatively short time
(Fig. 1.18b), and there is no accumulation of noise after the cut-off
time. However, Chen
et al
. [65] found that FD method is not always
reliable in practical EMD simulations where no obvious plateau can
be found in HCACF, as shown in Fig. 1.18c. This corresponds to the
realization that the mean value of HCACF can remain positive for a
relatively long time even after HCACF decays to zero (Fig. 1.18d).
In this case, FD method determines the cut-off time according to
the peak of the accumulative thermal conductivity (black arrow in
Fig. 1.18c), while there is already quite a lot of fluctuation in HCACF
long before the cut-off time.
In order to get a quantitative description of the numerical error,
Chen
et al
. [65] define the relative fluctuation of HCACF as
σ
(
Cor
(
t
))
E
(
Cor
(
t
))
F
(
t
)
=
,
(1.66)