Environmental Engineering Reference
In-Depth Information
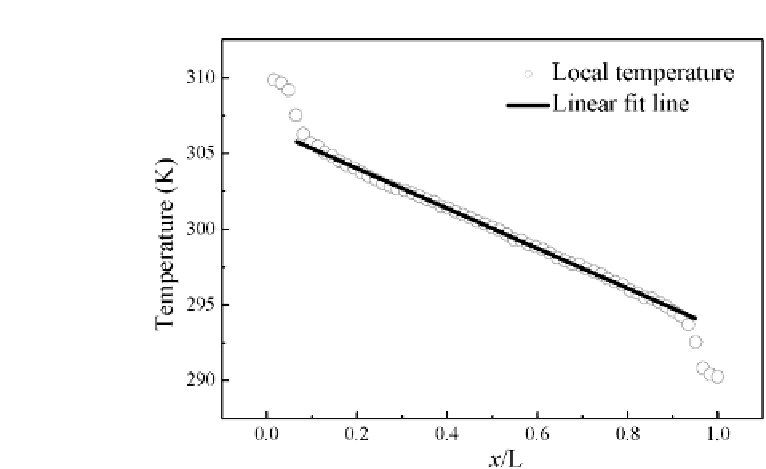
Figure 1.5
Temperature profile of SiNWs in NEMD simulation. The
longitudinal direction is set along
x
-axis. The hollow circle plots the local
temperatureofeachlayeralongthelongitudinaldirection,andthesolidline
is the linearfit line of the local temperature.
NEMD simulation is usually performed long enough to allow
the system to reach the non-equilibrium steady state where the
temperature gradient is well established (Fig. 1.5) and the heat flux
goingthroughthesystemistimeindependent.Thermalconductivity
iscalculated according to Fourier's law of heat conduction
J
∇
κ
=−
T
,
(1.34)
where
∇
T
is the temperature gradient that can be calculated from
the linear fit line of temperature profile (Fig. 1.5), and
J
is the
heat flux transported along the nanowire. In NEMD simulations,
the heat flux can be calculated according to the energy injected
into/extracted from the heat source/sink across unit area per
unit time. In a non-equilibrium steady state, these two rates are
equal.