Environmental Engineering Reference
In-Depth Information
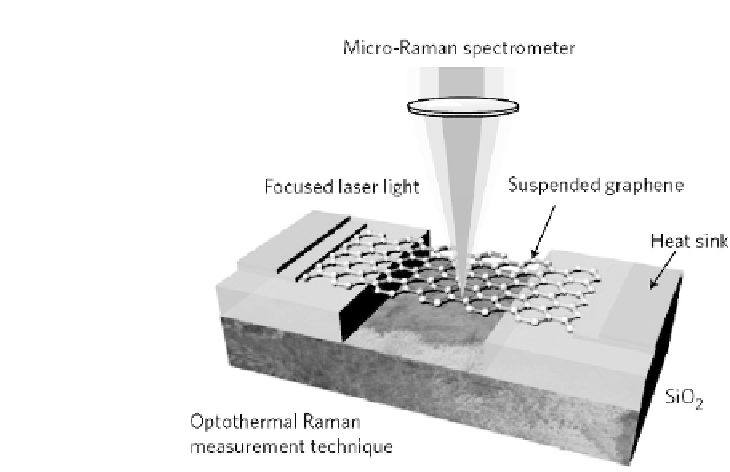
Figure 3.6
Schematic of the experimental setup for measuring the
thermal conductivity of graphene using the optothermal Raman technique.
Reprinted by permission from Macmillan Publishers Ltd:
Nature Materials
(Ref.[28]),copyright 2011.
characterization of spatial temperature profile. Many approaches
have been developed for measuring thermal conduction of quasi-
1D systems, such as nanotubes and nanowires. These approaches
can be roughly classified into two groups: contact and non-contact
approaches. In the former approaches, the measured samples are
heated by electricity. The sample temperature is characterized
by thermocouple [1], thermometer employing the resistance-
temperature relation [24], or
I
-
V
curves of Joule self-heating
experiments [25]. In the non-contact approaches, experimental
samples are heated by electricity [26] or by laser [27]. The
temperature profile is determined from the temperature-induced
shifts in the G band Raman frequency, which is referred as
optothermal Raman measurement technique. Most experiments
measure thermal conductivity of suspended graphene using the
optothermal Raman technique (depicted in Fig. 3.6) [28-33], and
some experiments investigate thermal conductivity of supported
graphene employing the contacted electrical approach [34].