Agriculture Reference
In-Depth Information
20
15
10
5
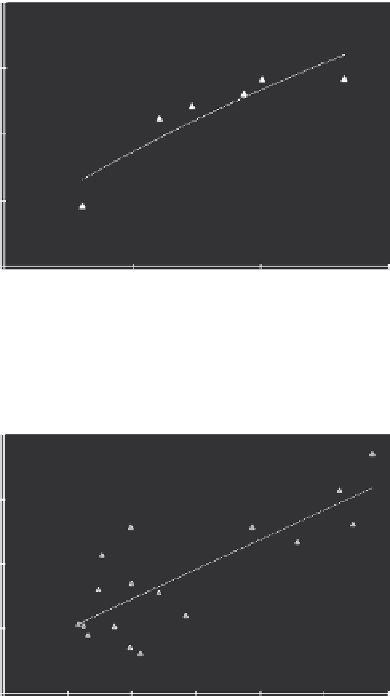
y
= 25.78 ln(
x
) - 74.31
R
2
= 0.82
0
20
25
30
35
Topsoil SOM (g/kg)
FIGURE 18.7
Correlation of mean agronomy use efficiency of N with SOM under long-
term fertilization trials in a rice paddy in Jiangxi, China.
80
60
40
20
y
= 0.92
x
+ 10.86
R
2
= 0.64
0
0
10
20 30
Topsoil SOM (g/kg)
40
50
60
FIGURE 18.8
Observed mean gross output of N applied as a function of topsoil OM in rice
paddies by the monitoring system of the Ministry of Agriculture, data of 2004.
The health of an agroecosystem could also be addressed by moderating the efflux
of GHG emission, especially in terms of C intensity of crop production, which has
been studied in detail by Zheng et al. (2011). For example, increase in N efficiency
could help to decrease fertilizer-induced C emission per unit of rice production,
which, in turn, results in a higher net C sink (Li et al. 2009a,b). And this has also
been true for a rice paddy in a site at Jiangxi, where a higher rate of SOC sequestra-
tion had been observed (Li et al. 2009b). In a case study by Zheng et al. (2006), the
metabolic quotient of soil microbial community and the respiratory quotient of SOC
were both reduced, while soil CO
2
evolution may be higher under SOC accumula-
tion under good fertilization. In many field studies, the correlation coefficient of soil
respiration with SOC content in rice soils without N being limiting was generally
low. Instead, soil respiratory activity and respired CO
2
flux were often shown to
Search WWH ::

Custom Search