Agriculture Reference
In-Depth Information
either in irrigated rice paddies (Pan et al. 2003; Zhou et al. 2006; Chen et al. 2007)
or in unirrigated dry croplands (Meng et al. 2005; Huang et al. 2006a; Wang et al.
2005). An experiment with tillage treatments in a purple sand-derived rice paddy
also showed a SOC enhancement since 1987 under conventional rice/rape rotation
farming systems from Southwest China (Huang et al. 2006b). Consequently, an over-
all SOC increase could be reasonably validated in China's croplands over the last
two decades (between 1990 and 2010), though with a wide range of 8 to 27 Tg/year.
A large uncertainty could be due to variable data size (Xie et al. 2007) and/or the
different accounting procedures used in these studies (Liu et al. 2004). For example,
a statistical analysis of the data from 26 sites of long-term agroecosystem experi-
ments in China showed the annual gain of topsoil SOC stock for all of the country's
croplands to be between 0.05 and 0.29 g/kg, using scenarios of balanced, compound
chemical fertilizer and a combined inorganic and organic fertilization. Therefore,
an overall annual SOC increase can be estimated to be in the range of 0.2 to 1.6 Pg
between 1985 and 2005 (Wu and Cai 2007).
(a)
60
50
40
30
20
10
0
-1
-0.8
-0.6
-0.4
-0.2
0
0.2
0.4
0.6
0.8
1
Relative annual change (g/kg/year)
(b)
50
40
30
20
10
0
Mean relative annual change in SOC (g/kg/year)
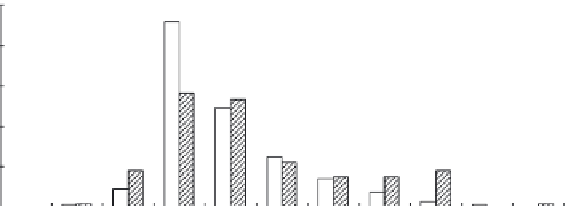
FIGURE 18.5
Topsoil SOC dynamics of China's croplands between 1982 and 2006.
(a) Estimated using data from soil monitoring. (b) Estimated using data from long-term
experiments. Blank, dry croplands; shaded, rice paddies.


Search WWH ::

Custom Search