Agriculture Reference
In-Depth Information
TABLE 1.1
Temporal Changes in Cereal Grain Yield on Regional Basis
Cereal Grain Yields (kg ha
-1
)
Continent
Region
1961
1971
1981
1991
2001
2010
Africa
Continent
810
986
1241
1236
1392
1501
Eastern
885
995
1252
1284
1363
1595
Middle
713
737
734
754
839
953
Northern
843
1277
1087
1672
1650
1852
Southern
1049
1415
2495
1860
2188
3600
Western
975
690
962
921
1009
1167
Asia
Continent
1212
1673
2146
2823
3176
3634
East
1414
2308
3182
4285
4823
5497
South
1012
1166
1448
1930
2430
2667
Americas
Continent
1912
2076
3209
3353
4218
5337
North
2203
3376
3840
4025
5054
6342
South
1347
1499
1941
2145
3146
4216
Caribbean
1176
1472
1886
1878
2185
2022
Oceania/Pacific
1115
1310
1434
1652
2255
1761
Europe
1379
2050
2046
2712
3418
3683
World
1353
1892
2247
2684
3136
3564
Source:
FAO. FAOSTAT, 2012. Available at
http://faostat.fao.org/Rome
.
6000
Americas
5000
4000
Europe
Asia
World
3000
2000
Africa
1000
1961
2001
2010
1971
1981
1991
Ye ar
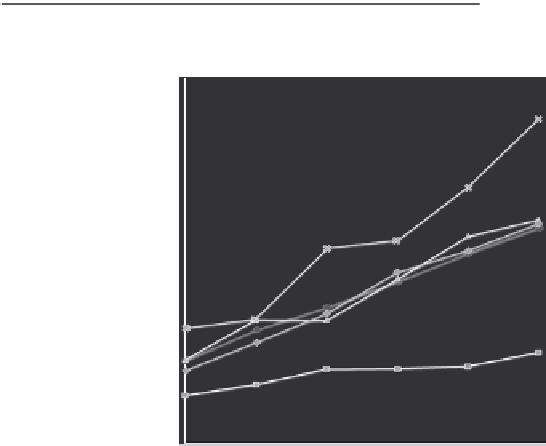
FIGURE 1.1
Temporal changes in cereal grain yields on regional basis between 1961 and
2010. (Redrawn from the data from FAO, FAOSTAT, 2012. Available at
http://faostat.fao.org/


Search WWH ::

Custom Search