Geoscience Reference
In-Depth Information
400
G
200
0
−
200
200
0
200
400
600
800
−
R
n
(W m
−
2
)
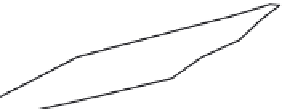
Fig. 2.26 Relationship between hourly values of soil heat flux
G
and net radiation
R
n
, both in W m
−
2
,
measured on a bare loess soil (Gilat Northern Negev Loess) under wet conditions (triangles) on
June 7-8, 1970, and under dry conditions (circles) on July 21-22, 1970. The arrows indicate the
sequence of the measurements in the course of the day; the two loops start at 0600 and end at
1800; the clusters of negative flux values represent the data points for the remaining 11 hours
on each day. The regression equations were found to be
G
=
0
.
334
R
n
−
34
.
9 for the wet soil
and
G
=
0
.
346
R
n
−
39
.
8 for the dry soil. (After Fuchs and Hadas, 1972.)
where
c
H
is a constant; for bare soil Kasahara and Washington (1971) have taken
c
H
=
1
/
3.
The soil heat flux can also be assumed to be proportional to net radiation, or
G
=
c
R
R
n
(2.86)
where, again,
c
R
is an empirical constant. From available experimental observations, it
appears that on average for bare soil
c
R
can be given a value around 0.3 (see, for exam-
ple, Fuchs and Hadas, 1972; Nickerson and Smiley, 1975; Idso
et al.
, 1975) (see also
Figure 2.26); however, for any given soil it can be expected to vary with moisture content.
For surfaces covered with vegetation
c
R
will normally be smaller and it will depend not
only on the soil moisture state of the soil but also on the type of vegetation; for example,
a value of 0.2 has been measured for maize (Perrier, 1975), and most measurements for
grass have yielded values around
c
R
=
0.1. To reduce the dependency of
c
R
on the type of
vegetation, Choudhury
et al.
(1987) considered the attenuation of the radiation by the plant
canopy and found that the following empirical adjustment
c
R
=
c
R0
exp(
−
a
La)
(2.87)
yields improved results. The parameter
c
R0
is the value of
c
R
in (2.86) for bare soil, La is the
leaf area index, which is the area (one side) of foliage per unit area of ground surface, and
a
is a parameter; with data over the midday hours, they found that
c
R0
=
0
.
4 and
a
=
0
.
5 for
wheat, with an inferred variation between 0.45 and 0.65 for different types of vegetation.
With measurements around midday on bare soil, soybeans, alfalfa and cotton, Kustas
et al.
(1993) obtained
c
R0
=
0
.
34 and
a
=
0
.
46 for La
<
4, and
c
R
=
0
.
07 on average for larger
values of La. A few typical values of the leaf area index La are listed in Table 2.9 for a
number of plant communities from the data collection of Scurlock
et al.
, 2001. Because the
leaf area index is not always easily estimated, several studies have also investigated the use