Geoscience Reference
In-Depth Information
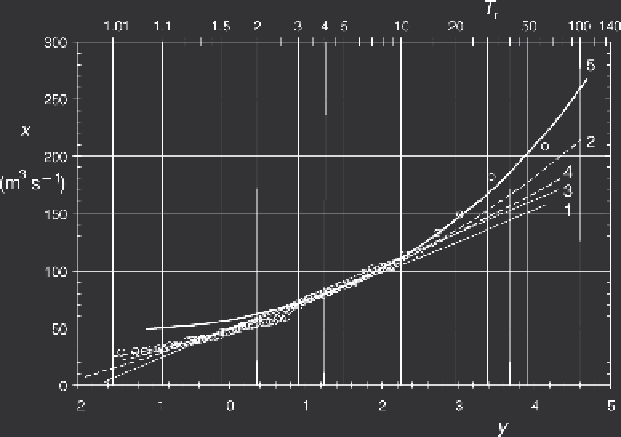
Fig. 13.14 Estimates of the probability distribution of the annual maxima of the rate of flow of the Sheepscot
River at North Whitefield, Maine, plotted with first asymptotic coordinates. The heavy solid line
(5) represents the power distribution, which was calculated with the parameters
a
=
48
.
10, and
b
3657. Also shown are the lognormal distribution (thin solid curve 1), the generalized log-gamma
distribution (dashed curve 2), the first asymptotic distribution for largest values (solid straight line 3)
and the generalized extreme value distribution (dashed line 4). Both the
y
=
0
.
=
α
n
(
x
−
u
n
) scale and the
T
r
(
x
) scale (in years) are shown. (See Example 13.9.)
hydrologic phenomenon in question may be derived from a knowledge of events that
date back to the time prior to the beginning of the systematic measurements. Because
most hydrologic records are notoriously short, it is desirable to include such information
whenever possible. Historical information may be derived from archived documents, or
from evidence of a botanical or paleo-event (see Kochel and Baker, 1982; Stedinger and
Baker, 1987) nature found in the natural environment.
Return periods
In practice, inclusion of information from the period prior to the start of the record is
concerned with the assignment of a plotting position to each historical event, whose
magnitude is known, in order to estimate the return period. As an illustration of pos-
sible scenarios for annual floods, consider the three cases discussed by Dalrymple
(1960).
(i)
A single historical event, larger than any event during the regular period of record,
is known to have occurred earlier. If
N
is the number of years since that historical
event or, better, the time since the beginning of recorded historical information,
the return period of the historical event can be taken as (
N
+
1), and its probability
as [
N
/
(
N
+
1)]. The regular record of duration
n
is treated as usual.