Geoscience Reference
In-Depth Information
F(x)
0
.0
1
0
.
1
0
.2
0
.3 0.4
0
.5
0
.6
0.
7
0
.
8
0
.9
0.
9
9
1000
5
2
4
3
x
(m
3
s
−
1
)
9
7
100
5
4
2
1
1
10
−
2.5
−
2
−
1.5
−
1
−
0.5
0
0.5
1
1.5
2
2.5
y=[ln(x)
−μ
n
]/
σ
n
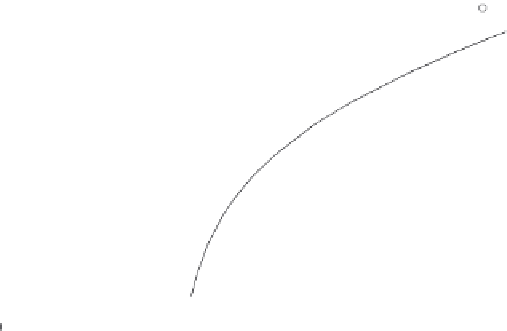
Fig. 13.10 Estimates of the probability distribution of the annual maxima of the rate of flow of Council Creek
near Stillwater, Oklahoma, plotted on lognormal probability paper. The heavy straight line 1
represents the lognormal distribution, which was calculated with the first two sample moments of the
logarithms
M
=
4.199, and
S
=
0.9145. The generalized log-gamma distribution (dashed line 2
curving upward) was obtained with these same moments and with the sample skew
g
s
=
0
.
3217. Also
shown are the first asymptote for largest values (solid line 3 curving downward), the generalized
extreme value distribution (dashed line 4 curving downward) and the power distribution (curve 5).
Both the
y
-scale and the
F
(
x
)-scale are shown. (See Example 13.7.)
of the order of 1000 mm. The 61 available peak flow data points, which are displayed
in Figure 13.10, have a sample mean
M
=
.
5m
3
s
−
1
, a standard deviation
S
=
104
.
9m
3
s
−
1
and a skew coefficient
g
s
=
.
127
964; for the logarithms these same quantities
are respectively 4.199, 0.9145, and 0.3217. The theoretical curve obtained with these
moments of the logarithms by means of Equation (13.44) is shown as the upward curving
dashed line 2 in Figure 13.10. Also shown in the figure are the theoretical curves for the
lognormal distribution (with
c
2
0) (1), the first asymptote (3), the generalized extreme
value distribution (4), and the power distribution (5). The parameters for the extreme
value distributions obtained with the appropriate sample moments are respectively
=
α
n
=
01003 m
−
3
s and
u
n
=
46.97 m
3
s
−
1
, and
a
01 m
3
s
−
1
0
.
=−
0.1751,
b
=
74
.
and
c
=
46.45 m
3
s
−
1
; for the power distribution the parameters are
a
=
39
.
91 and
b
=
0
.
7511.
13.4.5
The first asymptotic distribution of extreme values
Extreme values and their initial distribution
When several samples consisting of, say,
n
items are taken from the same population,
the
m
th smallest item in each sample is a random variable, which follows a certain
distribution function. The form of this distribution function of the
m
th quantile depends