Geoscience Reference
In-Depth Information
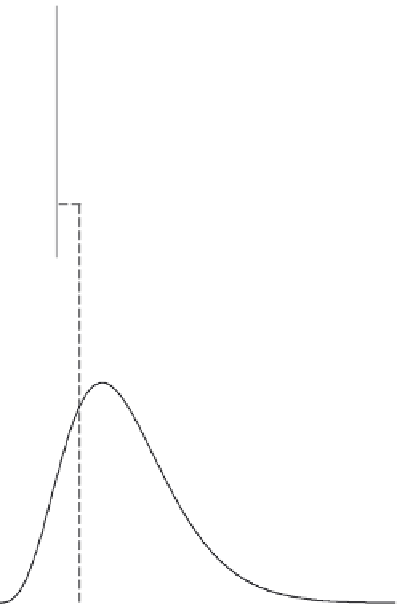
Fig. 13.2 Illustration of the relationship
between the distribution
function
F
(
x
) and the density
function
f
(
x
). The density
function is the slope of the
distribution function; conversely,
in accordance with Equation
(13.5),
F
(
x
0
) equals the area
under the
f
(
x
) curve to the left of
x
0
shown in the lower figure.
1
F(x)
0.5
0
−
5
0
5
10
15
x
0.2
f(x)
0.1
0
−
5
0
x
0
10
15
5
x
13.2
SUMMARY DESCRIPTORS OF A PROBABILITY
DISTRIBUTION FUNCTION
13.2.1
Moments
In the case of a discrete variable
X
, the
n
th moment about the origin is defined as
m
n
=
x
i
p
i
(13.7)
all
i
whereas the
n
th moment about the mean
μ
is
)
n
p
i
m
n
=
(
x
i
−
μ
(13.8)
all
i
For a continuous type variable
X
, the
n
th moment about the origin,
x
=
0, can be defined
as
+∞
m
n
=
x
n
f
(
x
)
dx
(13.9)
−∞