Geoscience Reference
In-Depth Information
Q
(m
3
s
−
1
)
Q
(cfs)
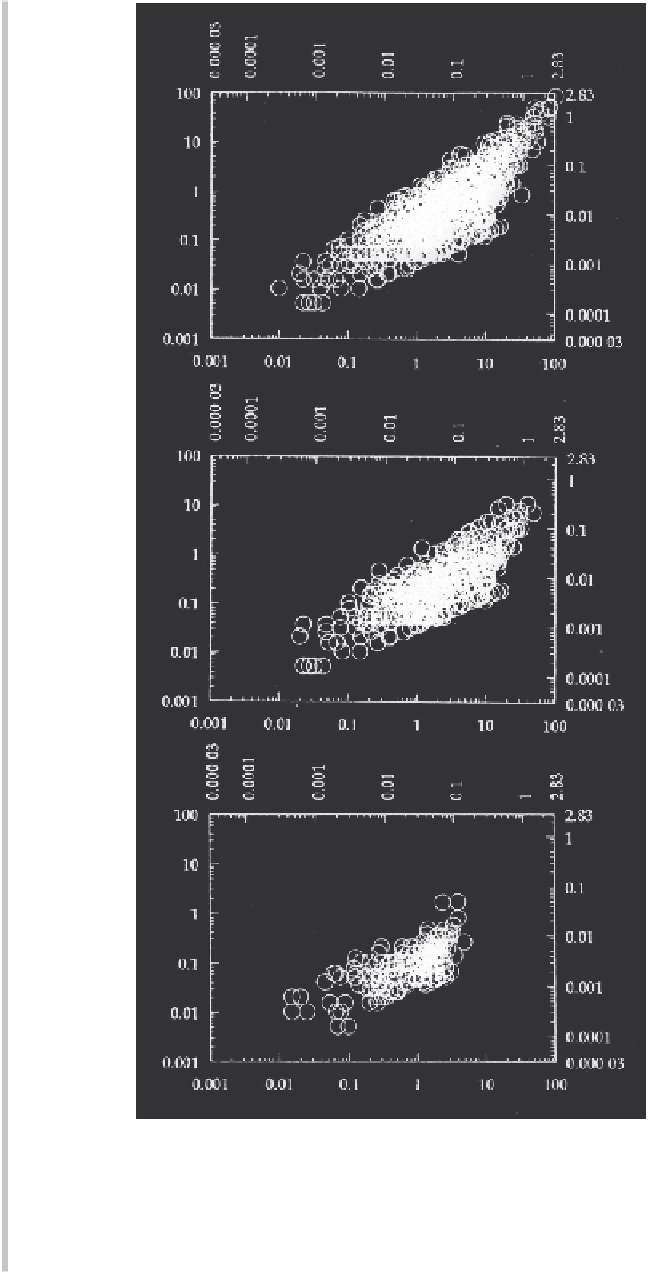
Fig. 10.38 Data points
−
dQ
/
dt
plotted against
Q
observed over drought flow episodes with the first day
taken 1 (top), 3 (center) and 6 (bottom) days after rain. The flow measurements were made
during the period 1962-1977 on West Bitter Creek within the Washita River basin in
Oklahoma. The drainage area of this basin is
A
=
154 km
2
, the total length of streams is
L
=
161 km, and the estimated mean depth of the surface aquifers is
D
=
1.3 m. (From Brutsaert
and Lopez, 1998.)