Geoscience Reference
In-Depth Information
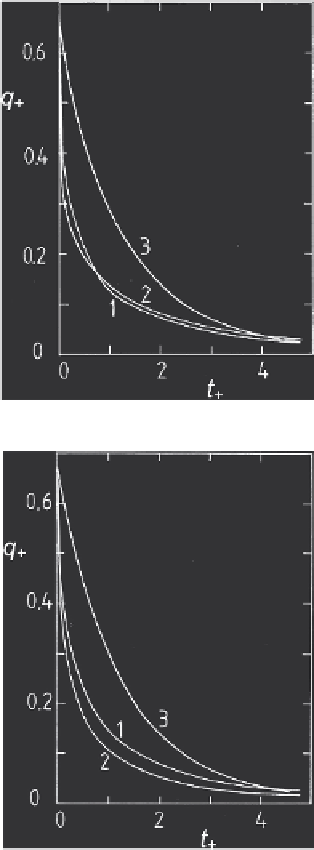
Fig. 10.7 Scaled outflow rate
q
+
from an aquifer with
rectangular cross section and with
D
c
+
=
0
,
B
+
=
1, plotted against scaled time
t
+
. The rate
of flow is scaled with (
Dk
0
) and the time
variable with [(
θ
0
− θ
r
)
D
]
/
k
0
. Curve 1
describes the outflow hydrograph for soil
properties (
aD
)
−
1
=
0
.
36,
n
=
3 and
b
=
2;
curve 2 for (
aD
)
−
1
=
0
.
36,
n
=
3 and
b
=
6;
curve 3 represents the case in which the partly
saturated zone above the water table is neglected
(see Section 10.2). (After Verma and Brutsaert,
1971b.)
Fig. 10.8 Same as Figure 10.7. Curve 1 describes the
outflow hydrograph for soil properties
(
aD
)
−
1
=
0
.
36,
n
=
3 and
b
=
1
.
5; curve 2 for
(
aD
)
−
1
=
0
.
36,
n
=
8 and
b
=
1
.
5; curve 3
represents the case in which the partly saturated
zone above the water table is neglected (see
Section 10.2). (After Verma and Brutsaert,
1971b.)
initial state of the unsteady drainage problem is thus taken to be a fully saturated aquifer,
in which the water table is assumed to be at the ground surface; such a condition can be
obtained by maintaining an infinitesimally thin layer of water on the surface at atmospheric
pressure. The exact solution of this classical steady state problem was derived by Kirkham
(1950).
Mathematical formulation
With the assumption of an effective hydraulic conductivity, the flow is governed by Laplace's
equation (8.57), or for a two-dimensional cross section
∂
2
h
∂
x
2
+
∂
2
h
∂
z
2
=
0
(10.5)