Geoscience Reference
In-Depth Information
5
4
f
c+
3
2
P
+
>
1
P
+
=1
1
P
+
<
1
0
0
1
2
t
+
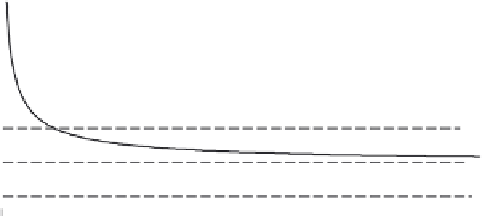
Fig. 9.15 Different precipitation intensities
P
+
(
=
P
/
k
0
) (dashed lines) superimposed on the scaled infiltration
capacity
f
c
+
=
f
c
+
(
t
+
) of a homogeneous deep soil profile (solid curve). When
P
>
k
0
the soil surface
becomes satiated after a finite period of time
t
=
t
p
, and ponding starts. When
P
=
k
0
the soil surface
becomes satiated eventually as
t
→∞
, but the rain can always seep into the soil and no ponding
occurs. When
P
<
k
o
the soil surface remains always unsaturated; eventually it reaches a water
content
θ
=
θ
s
, such that the near-surface hydraulic conductivity satisfies
k
(
θ
s
)
=
P
, and ponding
never occurs.
These changing conditions at the surface also have ramifications in the prediction,
and possibly control, of erosion and related processes. Prior to ponding the surface
soil is unsaturated, and therefore the soil water pressure is negative; this results in an
effective stress (cf. Equations (8.64) and (8.78)), which provides some cohesion to the
soil particles. Once the surface soil becomes saturated however, this effective stress
vanishes, and the particles can be more easily carried away by the runoff. Thus the onset
of ponding conditions may also mean the onset of erosion.
Another interesting feature of the solution of the rain infiltration problem is that it can
provide estimates of some hydraulic properties of the soil by inverse calculations with
measurements obtained in simple sprinkler irrigation experiments.
9.4.1
Mathematical formulation
During rainfall infiltration, the flow is again governed by Richards's Equation (9.1).
Consider the case when
P
k
0
, which eventually results in a satiated soil surface.
As already described briefly in Section 9.1.2, initially prior to ponding, the boundary
condition at
z
>
0 is of the flux type; once the surface soil moisture becomes satiated and
ponding starts, that boundary condition changes to a concentration-type condition. These
conditions are formulated as the second and third of (9.5), respectively, and they indicate
how the phenomenon takes place in two distinct phases. In principle, the complete
solution of (9.1) subject to (9.5), should be of the form
=
θ
=
θ
(
z
,
t
), which is the water
content distribution in the soil profile.


