Geoscience Reference
In-Depth Information
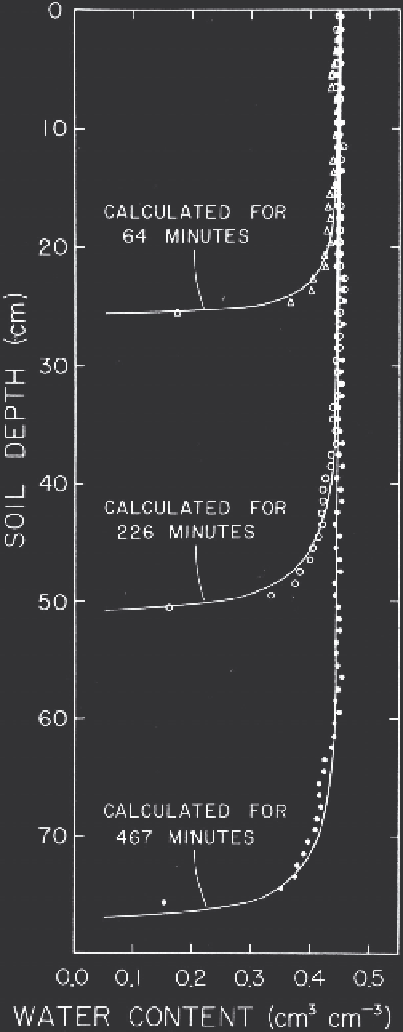
Fig. 9.1 Measured (points) and calculated (lines)
soil water content distribution during
vertical infiltration into a vertical column
of air-dry Columbia silt loam, with
θ
0
=
0
.
45. (From Davidson
et al.
, 1963.)
Long-time behavior
As illustrated in Figure 9.1, after longer times of infiltration, the water content profile
near the surface gradually becomes more uniform and it eventually assumes the satiation
value, or
θ
→
θ
0
; similarly, the pressure in the upper layers of the soil becomes gradually
atmospheric, or
H
→
0. Hence, their vertical gradients
∂θ/∂
z
and
∂
H
/∂
z
both approach