Geoscience Reference
In-Depth Information
100
80
S
e
(%)
60
40
20
0
0
10
20
30
H (=
−
p
w
/
γ
w
)
(cm)
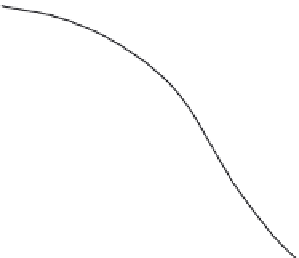
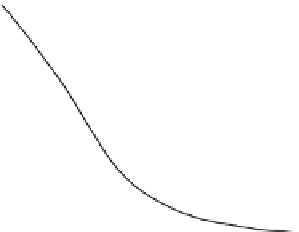
Fig. 8.19 Soil water characteristic curves in a sequence of wetting and drying paths following the same
sequence as in the example shown in Figure 8.17. The solid curves were obtained using the
experimental
F
function of Table 8.1, and the dashed curves were obtained by applying the
similarity assumption to the same data.
The wetting boundary curve can be calculated from (8.8) as
⎡
⎣
⎤
⎦
δ
H
w
H
m
δθ
=
F
(
x
)
dx
x
=
H
w
or
H
m
H
m
θ
=
F
(
x
)
dx dy
(8.13)
y
=
H
w
x
=
y
Other scanning curves can be calculated as before in the manner shown in the example with
Equations (8.11).
Example 8.3. Numerical calculation
The numerical procedure can be illustrated by using the same sequence as shown in
Figure 8.17. Assume for the present example
H
1
=
20 cm,
H
2
=
8 cm,
H
3
=
16 cm, and
4 cm. The calculations can be readily carried out by summing and subtracting the
values in Table 8.1, as indicated in Figure 8.17. The results for the regular independent
domain procedure using the values of Table 8.1 and those for Parlange's (1976) simplified
procedure using averaged columns in Table 8.1 can be compared in Figure 8.19.
H
4
=
While the determination of hysteresis curves is difficult enough with data obtained in
the laboratory, it is even more so with field data (see Royer and Vachaud, 1975; Watson
et al
., 1975). Therefore, although the independent domain approach and its simpler versions
may perhaps be considered crude approximations, they should be quite useful in practical
simulations of soil water flow problems. Certainly, the error resulting from this approxi-
mation will be much smaller than the unavoidably large errors resulting from uncertainties