Geoscience Reference
In-Depth Information
z
S S
0 . 5
C F
W T
0
0
0 . 5
1 . 0
S
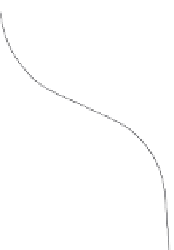
Fig. 8.7
Vertical distribution of the degree of saturation
S
under equilibrium conditions in a uniform soil
profile. SS indicates the soil surface, WT is the position of the water table, and CF the approximate
height of the capillary fringe. The height
z
above the water table is in meters; in this example the soil is
a fine sand and the curve is the same as shown in Figure 8.5. “Equilibrium” indicates that there is no
flow and that the soil water pressure distribution is hydrostatic.
Fig. 8.8
Sketch of a tensiometer installed in the field; a manometer fluid
has a column height
d
1
above that of the reservoir surface
d
2
; the
porous cup at the end of the tube, which is placed at depth
d
3
,is
filled with water in contact with the soil water; at A, the main tube
can be opened to fill it with water or to bleed it of air bubbles.
d
1
A
d
2
d
3
8.2.2
Mechanisms of water retention
Water or any other fluid can be held in natural soils by several types of mechanism, involv-
ing different forces at the molecular level. Some of the more important mechanisms can
be ranked, according to increasing energy required to remove the water, as follows.
(i) As water is removed from a non-shrinking saturated soil, it is replaced by air, and
water-air interfaces develop in the pore space; the energy required to form these
interfaces, and thus to withdraw the water, is directly related to surface tension.