Geoscience Reference
In-Depth Information
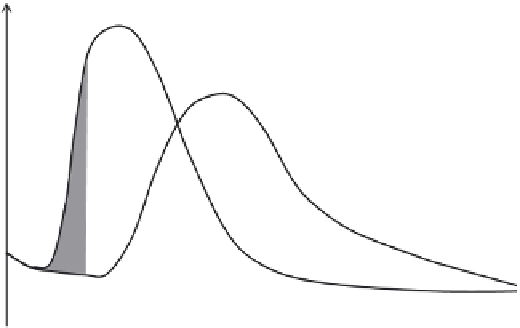
Q
i
dS/dt>0
Q
e
dS/dt<0
T i m e , t
Fig. 7.5
Illustration of the inflow hydrograph
Q
i
=
Q
i
(
t
) and the outflow hydrograph
Q
e
=
Q
e
(
t
) in a channel
reach, together with the rate of change of water stored in the reach during the passage of a flood wave.
As long as the inflow rate is larger than the outflow rate, i.e.
Q
i
>
Q
e
the storage is increasing, and as
soon as the opposite occurs, i.e. when
Q
i
<
Q
e
, the storage decreases. The shaded area indicates how
the storage itself increases with time, as
S
=
(
Q
i
−
Q
e
)
dt
.
average cross sectional area of the reach, or
S
=
[
XA
ci
+
(1
−
X
)
A
ce
]
x
(7.13)
where
X
is a constant reflecting the relative weight, which the cross sections at the inflow
end and at the outflow end exert on the average cross section (see Figure 7.6). Substituting
(7.12) in (7.13), one obtains
=
X
Q
1
/
e
α
−
1
/β
i
Q
1
/β
i
α
−
1
/β
e
S
+
(1
−
X
)
x
(7.14)
If it is further assumed that the cross sections at the inflow and outflow end exhibit
similarity, so that all the constants can be combined into one constant, say
K
, and
that the system is linear so that
β
=
1, one obtains finally the Muskingum storage
function
S
=
K
[
XQ
i
+
(1
−
X
)
Q
e
]
(7.15)
The constant
K
is also referred to as the storage coefficient. Substitution of (7.15) into
the storage equation (7.11) yields the governing differential equation
X
)
dQ
e
dt
KX
dQ
i
dt
Q
e
+
K
(1
−
=
Q
i
−
(7.16)
Interpretation of the parameters
Some insight can be gained in the nature of the parameters
K
and
X
by considering the
two main features of the flood wave in progress. These features are the time it takes
for the flood wave to pass through the reach, and the change in shape the flood wave