Geoscience Reference
In-Depth Information
(in mm month
−
1
)from
Lake Ontario during
1972-1973, as weighted
average values of
estimates by means of
mass transfer, energy
balance and water
budget methods. The
weighting factors were
based on the inverse of
each method's error
variances. (After Quinn
and Den Hartog, 1981.)
120
E
100
80
60
40
20
0
−
20
AMJ J A SO ND J FM
1972
1973
400
G
W m
−
2
R
n
L
e
E
200
0
H
200
−
G
400
−
A
M
J
J
A
S
O
N
D
J
F
M
1972
1973
Fig. 4.18 Weekly values (in W m
−
2
) of net radiation
R
n
(dashed line with diamonds), change in lake heat
content
G
(solid line with squares), advective heat inflow rate by rivers and precipitation (thin line
with solid circles), latent heat flux
L
e
E
(solid line with circles) and sensible heat flux
H
(dashed line
with triangles) for Lake Ontario during 1972-1973 from data in Pinsak and Rodgers (1981).
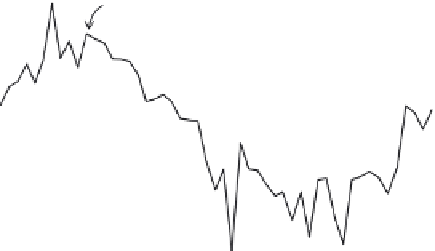
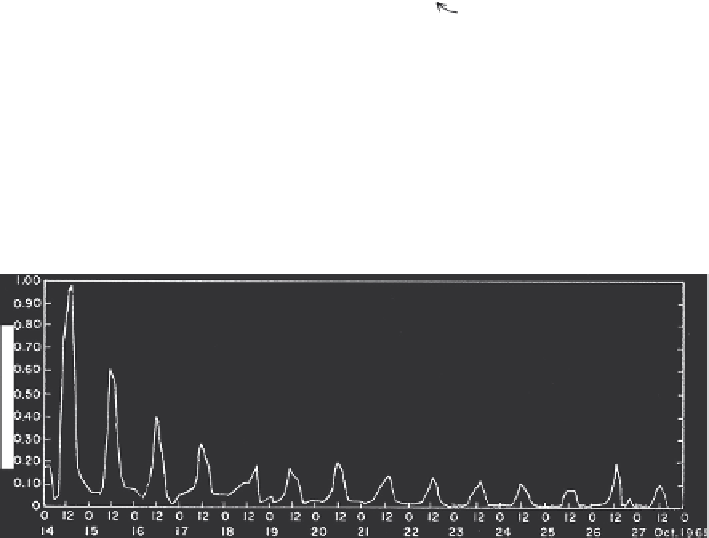
Fig. 4.19 Rate of evaporation from a bare soil surface during a drying cycle, measured with a weighing
lysimeter in Arizona. (From Van Bavel and Reginato, 1962.)