Geoscience Reference
In-Depth Information
5
E
4
(mm d
−
1
)
3
2
1
0
JFMAMJJASONDJ
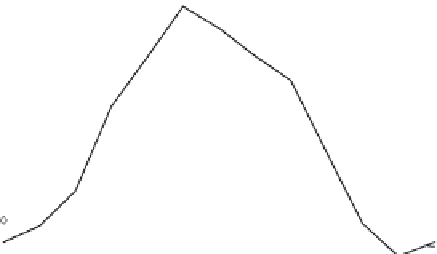
Fig. 4.16 Measured monthly evapotranspiration rates in mm/d for meadow covers on lysimeters at four
locations in the eastern United States. The data at Seabrook, NJ (diamonds), Waynesville, NC
(triangles) and Raleigh, NC (plus signs) represent maximal or near-maximal values, but the data at
Coshocton, OH (circles) are actual values, possibly affected by irregular rainfall and moisture deficits
in the soil profile. The annual mean values are 2.44 mm d
−
1
at Seabrook, 2.16 mm d
−
1
at Waynesville,
and 2.29 mm d
−
1
at Coshocton. (After VanBavel, 1961.)
rainfall cycle. In a humidclimate, or over water, the seasonal march of the evaporation
rate follows closely the cycle of energy available for evaporation. In most climates over
land the seasonal evaporation cycle is affected both by the available water and by the
available energy. As an example, inFigure 4.16 the monthly mean evaporation rates are
shown for several locations in the eastern United States. Thus, the cyclic behavior here
issimilar to the solar radiation input and to that of the air temperature. The same holds
true for shallow water bodies. But over deep water bodies the evaporation cycle does
not coincide with the solar winter-summer cycle. In contrast to a landsurface, a water
body can store and release large amounts of heat and thus its temperature responds only
slowly to energy inputs, not unlike the way a fly wheel responds to torque; as a result
the cycle of available energy for evaporation may lag several months behind the solar
input cycle. For example, the rate of evaporation from Lake Ontario is maximal in fall
and early winter, and minimal in late spring and early summer (Phillips, 1978), as is
also shown inFigure 4.17; the corresponding net radiation and heat storage are shown
inFigure 4.18.
The daily evaporation cycle is usually more pronounced over land than over water.
Over land, where much less heat is conducted below the surface, the daily cycle generally
follows the daily march of the solar radiation. Illustrations of the daily cycles of evapo-
transpiration from different surfaces are shown inFigures 2.19-2.22 and inFigure 4.9,
together with other components of the surface energy budget. In Figure 4.19 an example
is shown of the daily cycle of evaporation from bare soil. This figure also illustrates the
general behavior of evaporation after a rainfall or after irrigation, when the available
water stored in the soil profile is gradually being depleted. Because the experiment took
place during a drying period, the daily cycle is superimposed on a trend of decreasing