Geoscience Reference
In-Depth Information
Time (CDT)
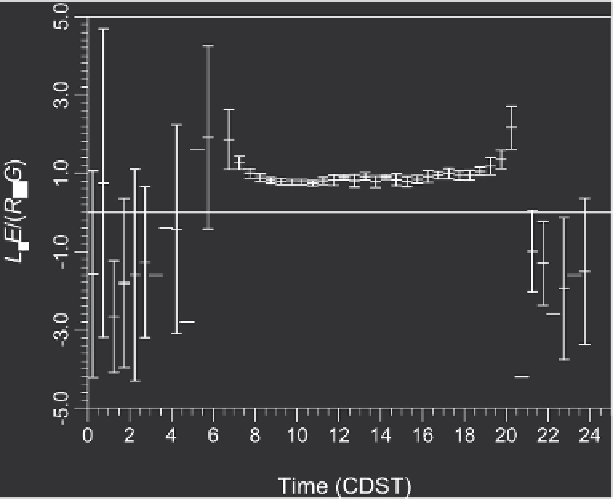
Fig. 4.11 Same as Figure 4.10, but only the evaporative fraction, i.e. the evaporative flux ratio
with
F
=
(
R
n
−
G
), is shown. The error bars indicate the mean and standard deviation for the
six measuring stations. (From Sugita and Brutsaert, 1991.)
1.5
EF
1
DOY=262
266
270
0.5
273
276
2
80
285
0
8
1 2
16
Time (CDT)
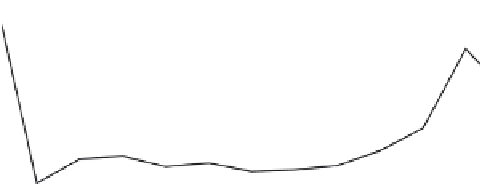
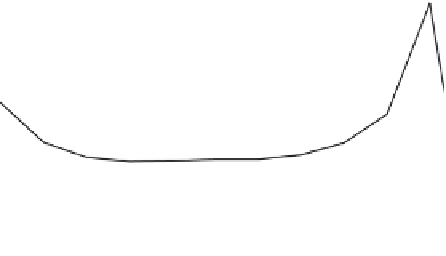
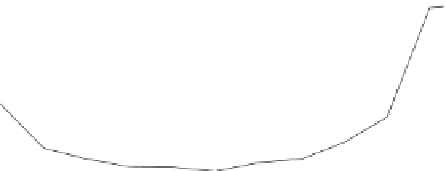
Fig. 4.12 Evolution of the diurnal cycle of the evaporative fraction EF
=
L
e
E
/
(
R
n
−
G
) over a period of
drying from Sept. 19 (DOY 262) through Oct. 12 (DOY 285), 1987, in a hilly prairie region in
northeastern Kansas. The time is Central Daylight Savings Time and the line numbers indicate
the day of the year, DOY. (From Brutsaert and Chen, 1996.)