Geoscience Reference
In-Depth Information
0
1
0.2
0.4
2
0.6
3
0.8
0
2
4
6
8
10
Wind speed (m s
−
1
)
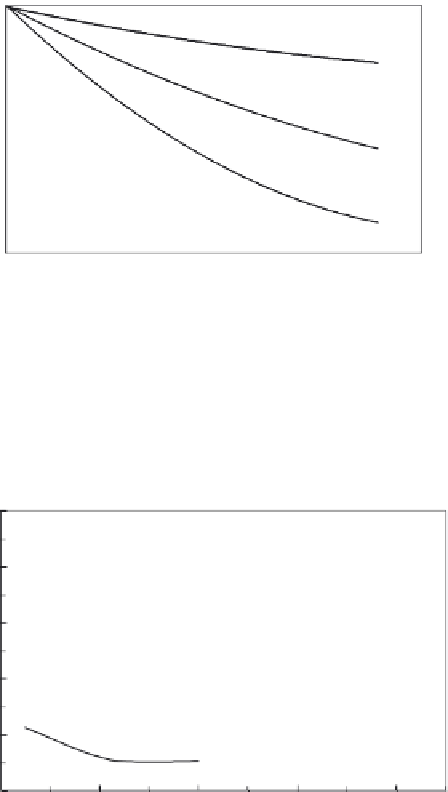
Fig. 3.21 Curves of gage catch deficiency against wind speed for liquid precipitation (curve 1); for solid
precipitation with a single shield around the gage (curve 2); and for solid precipitation with an
unshielded gage (curve 3). The curves represent a summary of data from different sites in the United
States, Russia and England, collected by Larson and Peck (1974). For rain the catches of shielded and
unshielded gages were nearly the same.
10
8
6
Wind
3-4 m s
−
1
(%)
2-3 m s
−
1
1-2 m s
−
1
0-1 m s
−
1
4
2
0
mm min
−
1
0
0.02
0.04
0.06
0.08
4.8 mm h
−
1
0
1.2
2.4
3.6
P
Fig. 3.22 Class averaged percentage difference (%) between precipitation measurements by elevated (at 1 and
1.5 m) Hellmann gages, and a ground-level gage, observed by Sevruk (1993a) as a function of mean
precipitation intensity
P
for different wind speeds. Based on data obtained at Les Avants, Switzerland,
April-September, 1938-1947.
of rainfall data by Sevruk (1993a) allowed him to derive the average wind induced error
as a function of rainfall intensity, as shown in Figure 3.22; these observations indicate
that the error increases rapidly with wind speed for small intensities, but more slowly
for larger intensities.
Different measurement techniques have been tried to solve this problem (see Rodda,
1967; Robinson and Rodda, 1969; Sevruk, 1974). The best is probably to use pit gages