Geoscience Reference
In-Depth Information
1
24 h
0.9
6h
0.8
3h
0.7
1h
0.6
30 min
0.5
0
200
400
600
800
1000
1200
Area (km
2
)
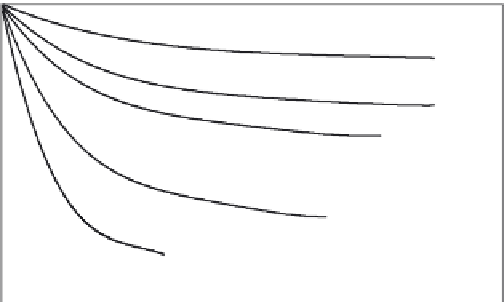
Fig. 3.14 Depth-area reduction curves for use with point rainfall frequency data. (After standard NOAA charts;
Hershfield, 1961.)
Fig. 3.15 Example of a double mass analysis,
showing the accumulated precipitation
at a single station (Spencer, West
Virginia) against the mean accumulated
values of 13 neighboring stations in the
same climatic division area. Exposure
conditions at Spencer changed around
1964 (after Chang and Lee, 1974).
20
Δ
y/
Δ
x=0.981
15
1955
10
Δ
y/
Δ
x=0.893
1965
5
1970
0
0
5
10
15
20
Accumulated precipitation (m), regional average
in exposure and location of the gage, in instrumentation or in measurement procedures
(see also Chang and Lee, 1974).
Example 3.2. Double mass curve
Figure 3.15 shows accumulated annual precipitation at Spencer, West Virginia, against
the mean accumulated precipitation values for 13 stations within the same climatic area in
southwestern West Virginia. The figure illustrates that a change in measuring conditions
occurred around 1964; the data prior to that date can be adjusted to these new conditions
by multiplying them by a factor in accordance with the change in slope
y
/
x
,as
shown.