Java Reference
In-Depth Information
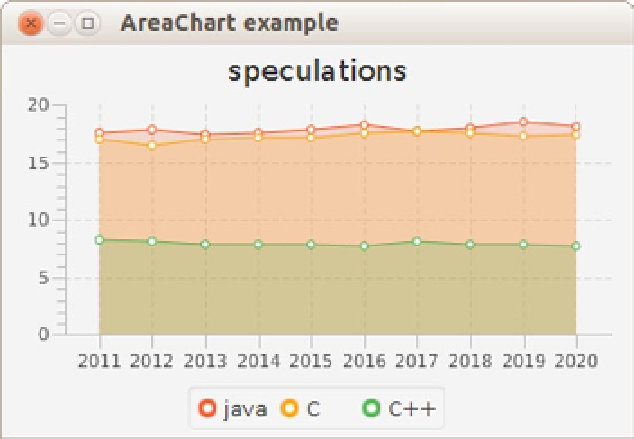
Figure 8-14.
Rendering area plots using
AreaChart
Using the StackedAreaChart
The
StackedAreaChart
is to the
AreaChart
what the
StackedBarChart
is to the
BarChart
. Rather than showing
individual areas, the
StackedAreaChart
always shows the sum of the values in a specific category.
Changing an
AreaChart
into a
StackedAreaChart
only requires the change of one line of code and the
appropriate import statement.
AreaChart areaChart = new AreaChart(xAxis, yAxis);
must be replaced with
StackedAreaChart areaChart = new StackedAreaChart(xAxis, yAxis);
Applying this change and running the application results in a graph like the one in Figure
8-15
.
Search WWH ::

Custom Search