Java Reference
In-Depth Information
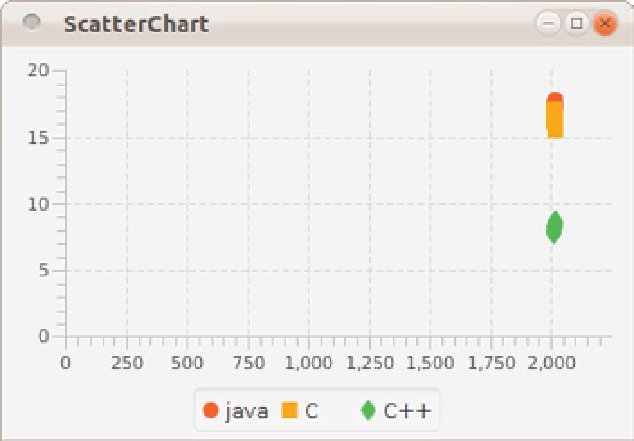
Figure 8-6.
The result of the naive implementation of the
ScatterChart
Although the chart shows the required information, it is not very readable. We add a number of enhancements,
but first let's have a deeper look at the different parts of the code.
Similar to the
PieChart
example, we created a separate method for obtaining the data. One of the reasons for this
is that in real-world applications, it is unlikely to have static data. By isolating the data retrieval in a separate method,
it becomes easier to change the way data are obtained.
A single data point is defined by an instance of
XYChart.Data<Integer
,
Double>
, created with the constructor
XYChart.Data(Integer i, Double d)
where the parameters have the following definitions.
i: Integer, representing a specific year (between 2011 and 2020)
d: Double, representing the hypothetical TIOBE index for the particular series in the year
specified by I
The local variables
javaValue
,
cValue
, and
cppValue
are used for keeping track of the scores for the different
programming languages. They are initialized with the real values from 2011. Each year, an individual score is
incremented or decremented by a random value between -2 and +2. Data points are stacked into a series. In our
examples, we have three series each containing 10 instances of
XYChart.Data<Integer
,
Double>
. Those series are of
type
XYChart.Series<Integer, Double>
.
The data entries are added to the respective series by calling
java.getData().add (...)
c.getData().add(...)
and
cpp.getData().add(...)
Finally, all series are added to the
ObservableList<XYChart.Series<Integer, Double>>a
nd returned.
The
start()
method of the application contains the functionality required for creating and rendering the
ScatterChart
, and for populating it with the data obtained from the
getChartData
method.
Search WWH ::

Custom Search