Geology Reference
In-Depth Information
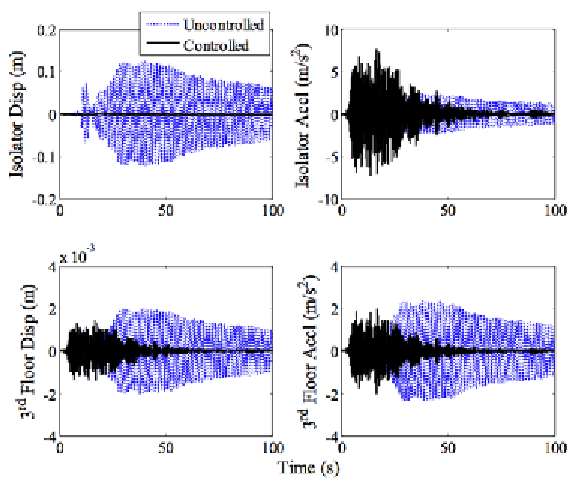
Figure 26. Base isolator and third-floor displacement and acceleration responses under Big Bear earth-
quake for GA-FLC based MR damper monitoring
also increased from 2.3631 m/s
2
in uncontrolled
case to 2.5526m/s
2
in clipped optimal case.
Figure 29 shows the input voltage to the MR
damper and the corresponding control force at
the damper location. The voltage plot is shown
from 20s to 40s of the voltage time history. As
is seen from Figure 29 there are frequent jumps
in the voltage plot from zero to maximum 5V.
This is same all through. It is to be noted that the
maximum allowed input voltage is not supplied
for all the time, which is observed in the clipped
optimal case.
For dynamic inversion based control law the
primary control force is obtained using LQR al-
gorithm ('lqr' function available with Control
Toolbox. The matrix
Q
Figure 27. Voltage input and control force under
Big Bear earthquake for GA-FLC based MR
damper monitoring
= ×
5 10
3
×
I
8 8
and
×
R
= ×
−
1 10
4
are considered for the study.
I
8 ×
is an identity matrix of dimension (8×8). The gain
k
e
is taken as 10. The tolerance values in Equation
(25) are taken as
tol
1
−
5
= ×
1 10
m
and
−
5
m/s.
Figure 30 shows the time histories of the
uncontrolled and controlled system responses
(displacement and acceleration) of base isolator
and at the third floor under Big-bear ground mo-
tion. The uncontrolled (simple base isolation) and
controlled (hybrid isolation) displacement and ac-
tol
2
= ×
1 10

Search WWH ::

Custom Search