Geology Reference
In-Depth Information
=
due to the inherent eccentricity in the model
introduced in the fabrication process. This is not
analyzed further as the analytical predictions of
the experiments are quite close to the test results
across different displacement and acceleration
time-histories. Figure 7 shows the progress in
PSO convergence as the number of generations
in the optimization increased.
The mass of the base is measured to be 38 kg.
The stiffness of the linear springs attached co-
axially with the sliding isolator is measured using
servo-hydraulic testing machine. The stiffness of
each of the springs is found to be 2.162kN/m. A
nonlinear frictional damping
f
M
kg
a
62 76
.
0
0
0
64 20
.
0
0
0
59 40
.
Ns
m
2
C
=
×
10
a
5 23
.
−
2 23
.
0
−
2
.23
2 33
.
−
0 1
.
0
−
0 1
.
0 1
.
N
m
K
a
10
2
=
×
1 04
.
0 74
.
0
−
−
0
.
74
1 49
.
−
0 76
.
0
0 76
.
0 76
.
−
(
µ
is
considered for the isolator, where μ is the coef-
ficient of friction (Sahasrabuddhe and Nagara-
jaiah, 2005; Madden et al., 2002) and is given by
=
wz
b
w
(11)
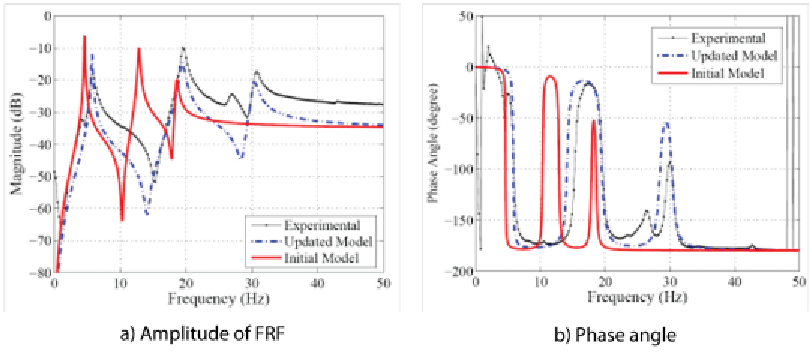
Figures 6a and 6b show the comparison of
amplitude and phase angles for experimental
and analytical models measured at third floor
respectively. Both the initial and updated analyti-
cal FRFs are presented to show the convergence
of updated model using PSO algorithm. Initial
model refers to system parameters prior to the
PSO runs. There is a small peak at 27.1Hz in the
experimental curve, which may be attributed to
some transverse motion present in the structure
x
−
λ
µ
=
µ
−
(
µ
−
µ
)
e
(12)
max
max
min
where
µ
ranges from
µ
max
at large velocities of
sliding to
µ
min
at very low velocities. λ is a con-
stant having units of time per unit length and
x
b
is the velocity across the isolator. The value to
Figure 6. FRF measured at third floor showing amplitude and phase angle on the initial guess, updated
model and the experimental obtained FRF


Search WWH ::

Custom Search