Geology Reference
In-Depth Information
Table 1. Modal frequencies
where
µ
is a dissipation constant. A very low
value of
µ
indicates strong non-viscous charac-
teristics and a high value of
µ
indicates close to
viscous characteristics (Adhikari 2000). Now the
interesting question is which of these
µ
values
would reflect reality? At this point of time unfor-
tunately this question remains unanswered and
demands further research. In this sensitivity study
we use
µ
=1.0, 5.0 and 50.0, based on past research
evidence (Adhikari, 2000).
Modes
Frequency (Hz)
1
0.85793
2
2.5239
3
4.0433
4
5.3276
5
6.3023
6
6.9108
Analysis of the Controlled Frame
Results and Discussions
Direct time integration is performed using the
Newmark total equilibrium method (Carr 2007).
MATLAB codes were developed for the time
domain analysis incorporating both classical Ray-
leigh viscous and non-viscous damping models.
In the case of non-viscous damping, a single ex-
ponential model called Biot's relaxation function
is used as the Kernel function. Biot's relaxation
function is of the form
Figures 8 and 9 represent the time histories of the
displacement and acceleration responses of the
roof due to the Chi-Chi ground motion with the
classical viscous damping model and non-viscous
damping models with different values of
µ
. The
duration of the Chi-Chi ground motion used is 40
seconds and the response is evaluated till 60
seconds. The comparisons plotted in the figures
can be used to investigate the effect of different
non-viscous damping models in comparison with
the classical viscous damping model. One quali-
tative observation that could be made from both
−
µ
t
µ
e
g t
( )
=
(4)
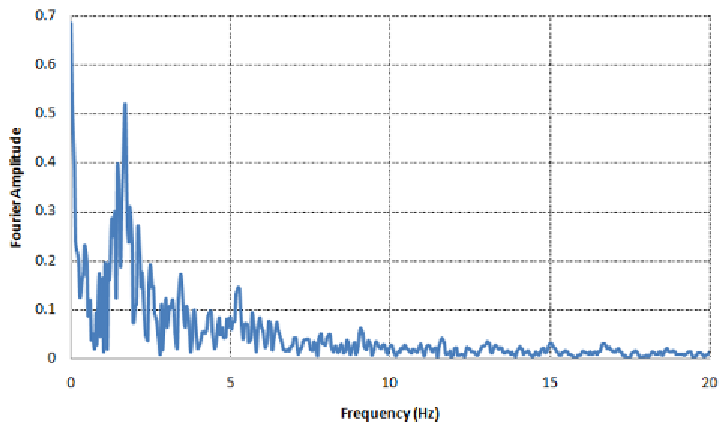
Figure 6. Fourier amplitude spectra of the Chi-Chi and the Sakaria


Search WWH ::

Custom Search