Biology Reference
In-Depth Information
A
2,655,769
3,541,026
4,426,282
0
885,256
1,770,513
2,003,368
2,066,814
2,130,260
1,813,030
1,876,476
1,939,922
RefSeq_genes
Ensembl_genes
XenBase_genes
RNA-Seq TF +T3
150
113
75
38
0
1,810,000
1,842,000
1,874,000
1,906,000
1,938,000
1,970,000
2,002,000
2,034,000
2,066,000
2,098,000
2,130,000
RNA-Seq TF +T3
8
6
4
2
0
1,860,000
1,881,000
1,902,000
1,923,000
1,944,000
1,965,000
1,986,000
2,007,000
2,028,000
2,049,000
2,070,000
B
407,946
0
203,973
611,918
815,891
1,019,864
507,496
513,916
520,337
526,757
533,178
539,598
Ensembl_genes
RNA-Seq
120
90
60
30
0
508,000
511,200
514,400
517,600
520,800
524,000
527,200
530,400
533,600
536,800
540,000
?
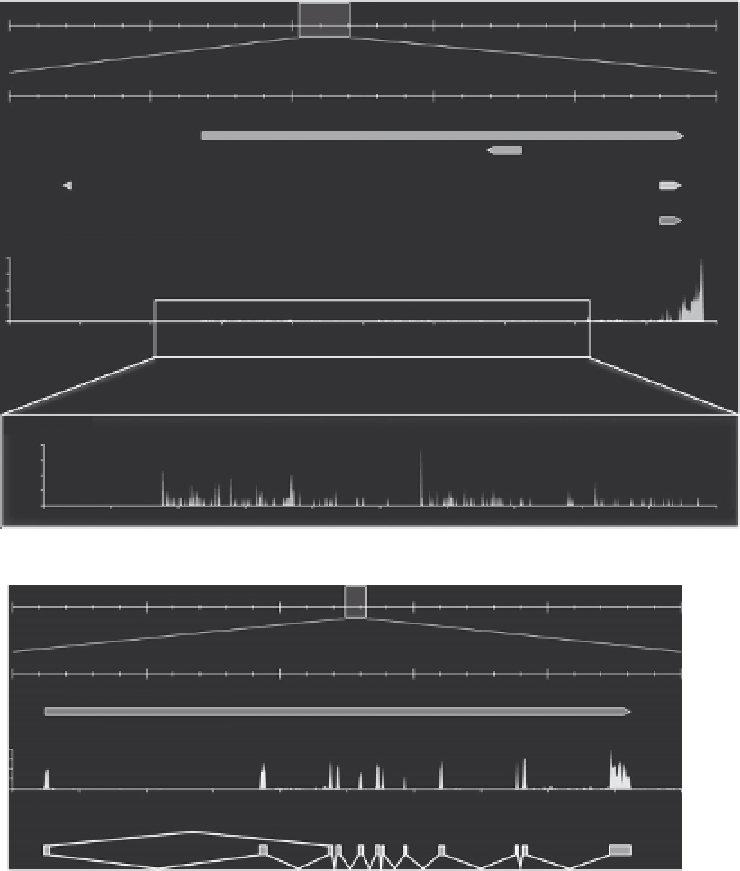
Figure 10.3 RNA-Seq profiling provides a quick overview of transcription units. (A) RNA-
Seq profile at the TR
b
locus. The first three tracks represent the gene models from the
same databases as in
Fig. 10.2
. The fourth track represents the RNA-Seq profile obtained
from the tail fin of premetamorphic tadpoles treated with T
3
. The bottom part is a close-
up of the TR
b
transcription unit which is occulted by the very strong signal at the 3
0
end
of the gene. (B) Conventional RNA-Seq does not provide information on alternative
splicing: Example of the wntless homolog (wls) on scaffold_431. The first track repre-
sents Ensembl gene models. The second track corresponds to the RNA-Seq profile.
The third track corresponds to annotated exons and indicates two known alternative
transcript are generated by exon skipping (connecting lines).