Biology Reference
In-Depth Information
A
B
lc
nt
B
n
C
D
nt
lc
D
n
E
E
F
lc
nt
lc
n
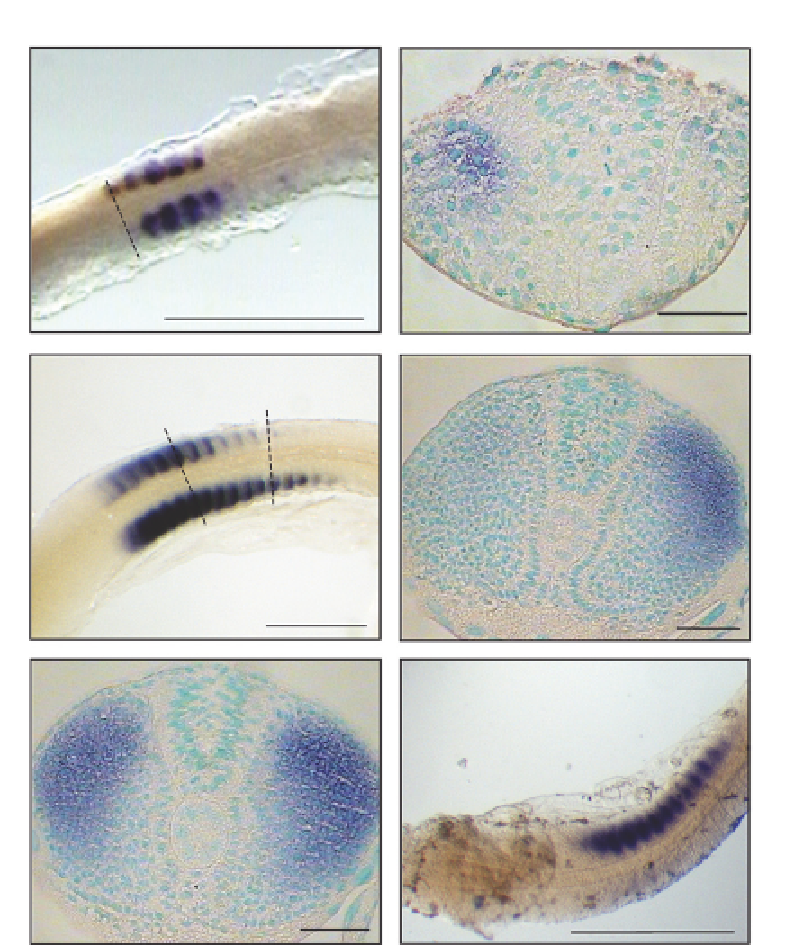
Figure 6.6 Left-right asymmetric expression of myod2 in Atlantic halibut during
somitogenesis analyzed by whole-mount in situ hybridization. (A) Asymmetric myod2 sig-
nal shown as one additional positive somite at five somites (75% epiboly). Stippled line
indicates site of transverse section. (B) Transverse section showing left-sided expression of
myod2 in lateral cells at five somites. (C) Right-sided asymmetric expression of myod2 in
embryo at 20 somites. Transverse sections shown in picture (D) and (E) are indicated by
stippled lines. (D) Transverse section of the embryo in picture C demonstrating myod2
expression in the lateral cells on the right side. (E) Transverse section of the embryo in
picture C with stronger myod2 signal on the right side. (F) Embryo at 45 somites with
nomyod2 signal on the right side of the midline. All embryos are positioned with the head
toward right and are seen dorsally. The sections are positioned with the dorsal side on the
top of the picture. lc, lateral cells; n, notochord; nt, neural tube. Scale bars for the whole
embryos and transverse sections equal 0.5 mm and 50
m
m, respectively. Reproduced with
permission from
Andersen et al. (2009)
.