Biology Reference
In-Depth Information
A
Atlantic halibut
(
Hipoglossus hipoglossus
)
B
Japanese flounder
(
Paralichthys olivaceus
)
C
Senegalese sole
(
Solea senegalensis
)
D
Conger eel
(
Conger myriaster
)
E
Coho salmon
(
Oncorhynchus kisutch
)
F
Chum salmon
(
Oncorhynchus keta
)
G
Glithead seabream
(
Sparus aurata
)
H
Grouper
(
Epinephelus coioides
)
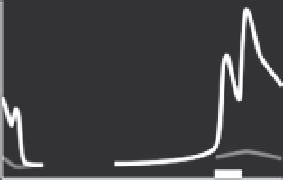
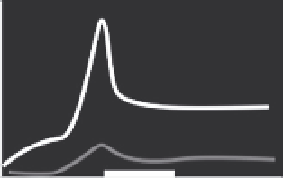
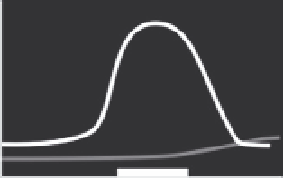
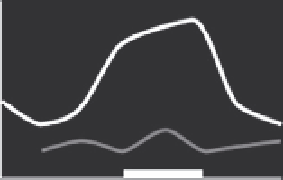
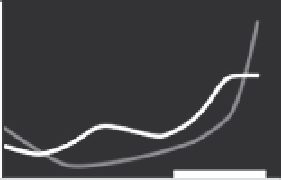
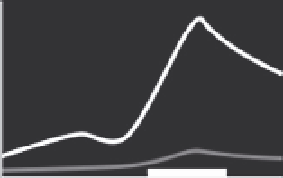
Figure 5.7 Relative whole-body concentrations of thyroid hormone in different teleosts
during larval and juvenile development. Developmental stage is indicated by the x-axis
and the horizontal black bar shows the approximate climax of the metamorphic period.
Black line indicates relative level of thyroxine (T4); gray line indicates relative level of tri-
iodothyronine (T3); lines redrawn from original figures. Relative concentrations shown
for three flatfish: (A) Halibut (
Galay-Burgos, Power, Llewellyn, & Sweeney, 2008
);
(B) Flounder (
Yamano & Miwa, 1998
); and (C) Sole (
Klaren et al., 2008
). Also shown
are (D) Eel (
Kawakami, Tanda, Adachi, & Yamauchi, 2003
), two species of salmon:
(E) Coho salmon (
Harada, Yoshinaga, Ojima, & Iwata, 2008
) and (F) Chum salmon
(
Parhar & Iwata, 1996
); (G) Seabream (
Szisch, Papandroulakis, Fanouraki, & Pavlidis,
2005
); and (H) Grouper (
de Jesus et al., 1998
).