Environmental Engineering Reference
In-Depth Information
the difference between the sections before and after the damage. It shows that at
thenorthsidebreakwater,themoundwasscouredbetween5and10m.Atboththe
south side breakwater and north side breakwater, the shoulder of the slope of the
mound on the inside port side was severely deformed, and the caisson slid down
the mound.
14.3
Protection Effectiveness of Breakwaters
14.3.1
Conditions of Numerical Simulation
At Kamaishi Bay, various parts of the breakwaters were damaged. Because the
inluenceoftheprotectiveeffectivenessofbreakwaterswasunclear,numericalsim-
ulationswereconductedtostudytheeficiencyoftheprotectiveeffect.ASTOC-ML
(Tomita et al.
2006
) simulator was used to approximate wave pressures as hydro-
static pressures and to calculate free water surface positions with a continuity equa-
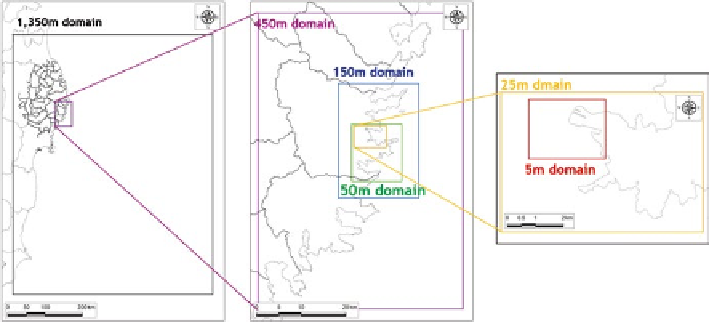
tion.NestedgridsareusedasshowninFig.
14.6
.
Thegridsizeoftheinalcalculationdomainis5m.Calculationsareconducted
under 7 conditions on the state of breakwaters. No breakwaters is set as Case 1,
which is the basic data to which the results of other cases are compared. In Case 2,
the breakwater is assumed to have no damage, retaining the shape it had before
struck by the 2011 tsunami. Case 3 is the ideal case, that is, the whole baymouth is
closedbytheD.L.+6.0mhighwall.InCase4,thesimulationisconductedusing
the shape after the 2011 tsunami. Because the safety factor of the submerged break-
waters is the lower than that of the other breakwaters, the effect of the submerged
breakwatersisnegligibleinCase5.Theresultsofthesafetyfactorindicatedthat
there was a high possibility that the north side breakwater was the last to be washed
Fig. 14.6
Computational domains
Search WWH ::

Custom Search