Environmental Engineering Reference
In-Depth Information
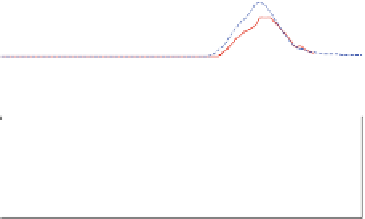
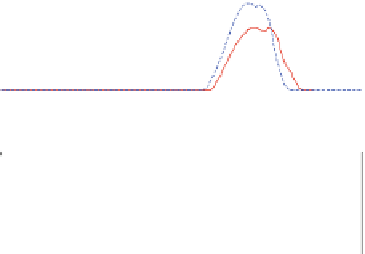
Fig. 9.2
Comparison of
surface elevation on the land
between numerical results by
Q3D model with/without
offshore breakwater and
survey data (locations:
a
-
d
from
top
to
bottom
denoted in
Fig.
9.1a
,
solid line
: with
breakwater,
dashed line
:
without breakwater,
dashed
horizontal line
: survey data
by TTJS
2011
and Mori et al.
2011
)
20
10
0
0
10
20
30
40
50
60
70
40
20
0
0
10
20
30
40
50
60
70
20
10
0
0
10
20
30
40
50
60
70
20
with breakwater
without breakwater
10
0
0
10
20
30
40
50
60
70
time [min]
20
TTJT Survey Measurement
Hybrid 2DH-3D (Partial BW)
Quasi-3D (20m Bar)
2DH (Partial BW)
15
10
5
0
10
20
30
40
Survey Location Number
50
60
70
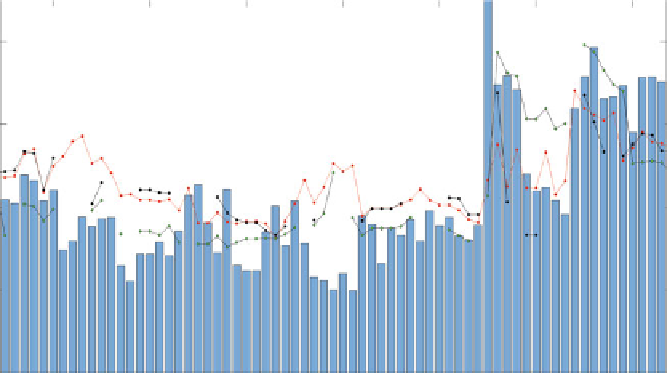
Fig. 9.3
Comparison of maximum inundation height along the coast between three models and
survey data (
bar
: survey data (TTJS
2011
; Mori et al.
2011
),
red line
: 3D model,
green line
: Q3D
model,
black line with circle
: 2D model, position of location number is denoted in Fig.
9.1
)


Search WWH ::

Custom Search