Geology Reference
In-Depth Information
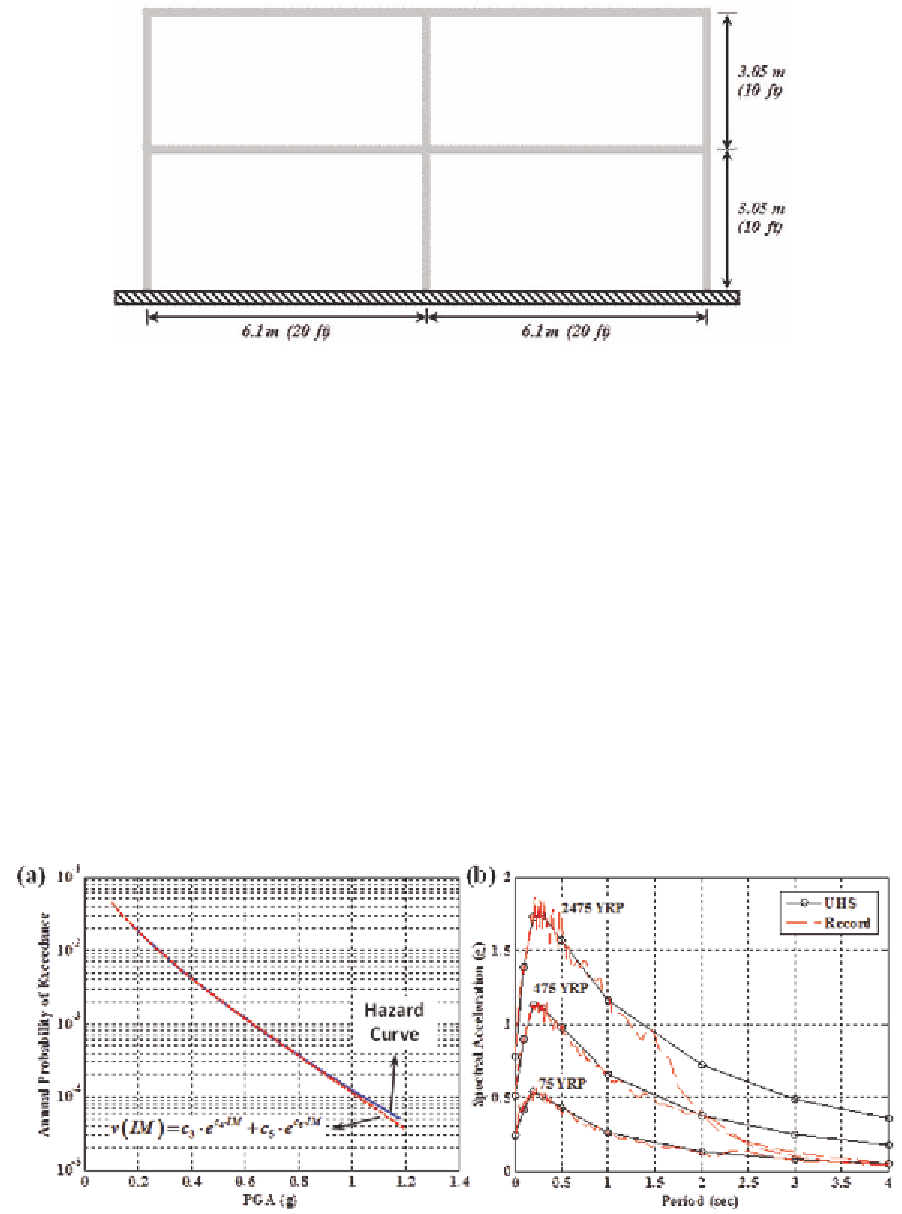
Figure 10. RC frame structure used for the example application
found from Eqn. (2) and the expected LCC of the
structure is obtained from Eqn. (1).
During the optimization process, TS algorithm
is allowed to search 10% of the search space. In
other words, the maximum number of objective
function evaluations is set 3000 for each hazard
level. Figure 12(a) shows the combinations of the
design variables (in the solution space) that are
searched by the TS algorithm to obtain the Pareto-
front which is also shown in the same figure with
a solid line with circle marks. It is seen that the
algorithm is very effective in terms of narrowing
down the search space to the points that are close
to the Pareto-front. The initial and the total costs
of the building vs. the maximum interstory drift
under the 2475 years return period earthquake is
shown in Figure 12(b) [only for optimal solutions].
It is seen that there is a compromise between
the initial cost, LCC and structural performance
(represented with maximum interstory drift). As
the initial cost increases it approaches the LCC
and the maximum interstory drift is reduced (bet-
ter structural performance) while the LCC and
the maximum interstory drift are significantly
higher for lower initial cost solutions. This type
of a representation is very important for the use
Figure 11. (a) Site specific hazard curve, (b) UHS and spectrum compatible earthquake records
Search WWH ::

Custom Search