Geology Reference
In-Depth Information
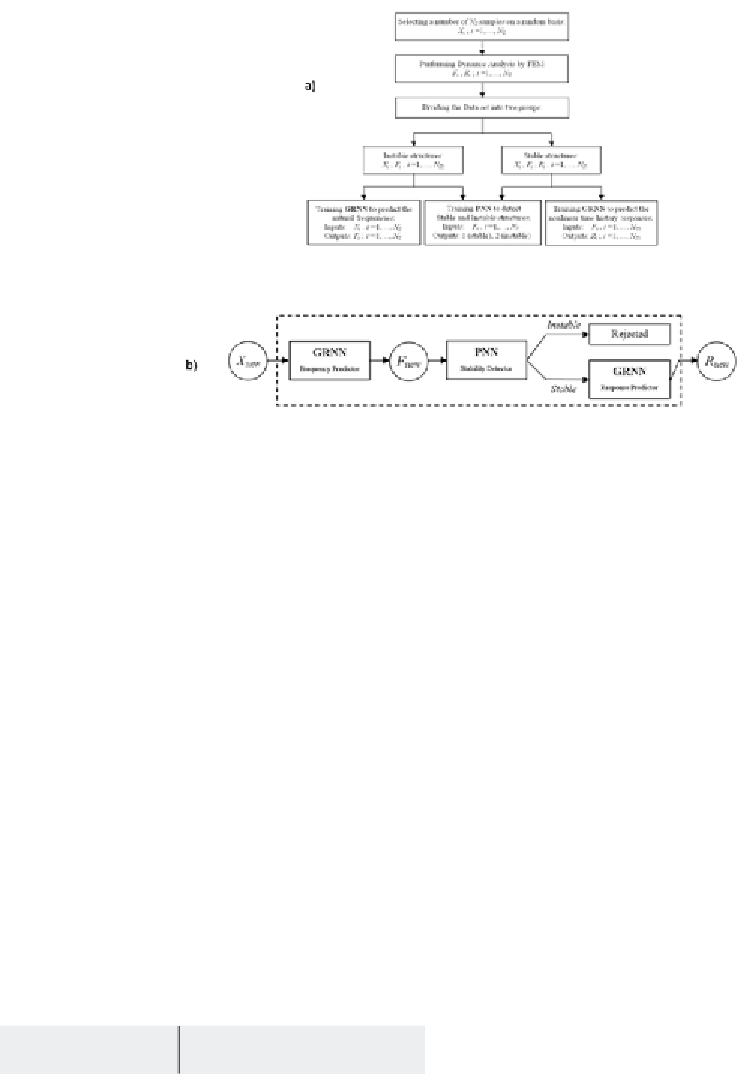
Figure 2. Outlines of the HNNS in (a) training and (b) normal modes
ing 50 stable and 4 instable ones are considered,
respectively. The testing results of PNN, shown
in Figure 4(a), indicate that there is good confor-
mance between exact results and predicted ones
by PNN. However by adding more instable struc-
tures to the data set the accuracy of the PNN can
be improved. The time spent to train and test the
PNN is 1.0 min.
In order to predict the top node displacement
of the structure another GRNN is trained. As the
instable structures will be rejected during the
optimization process, therefore the GRNN is only
trained to predict the nonlinear responses of the
stable structures. In this case, the training set
includes the
N
S
1
stable structures including their
corresponding natural frequencies as the inputs
and the nonlinear time history displacements of
the top node as the outputs. To train and test the
network 100 and 50 samples are considered, re-
spectively. The size of the GRNN is 3-100-750.
The results of testing the performance generality
of the GRNN are shown in Figure 4(b). The time
spent to train and test the network is 1.35 min.
The results imply that the generalization of the
GRNN is appropriate.
The optimization task is achieved by the CGA
and MCGA with 30 individuals using the exact
nonlinear dynamic Analysis (ENDA) and approxi-
mate analysis by HNNS (HNNS). The maximum
number of generations is limited to 100. In each
optimization case, ten independent optimal design
processes are performed and the best solution
found, the average number of generations and
the average time of optimization are given as the
final results. In the optimization process based
on approximate analysis, to distinguish feasible
and infeasible solutions, the criterion proposed
by Vanderplaats (1999) is involved: if the sum
of the violated constraints is less than 0.005, the
corresponding solution is feasible, otherwise the
Table 1. Testing errors of the GRNN
Natural frequencies
Mean error
(%)
Maximum error
(%)
f
1
0.7320
2.1042
f
3
0.1420
1.1308
f
5
0.4792
1.6149
Average
0.4511
1.6166


Search WWH ::

Custom Search