Geology Reference
In-Depth Information
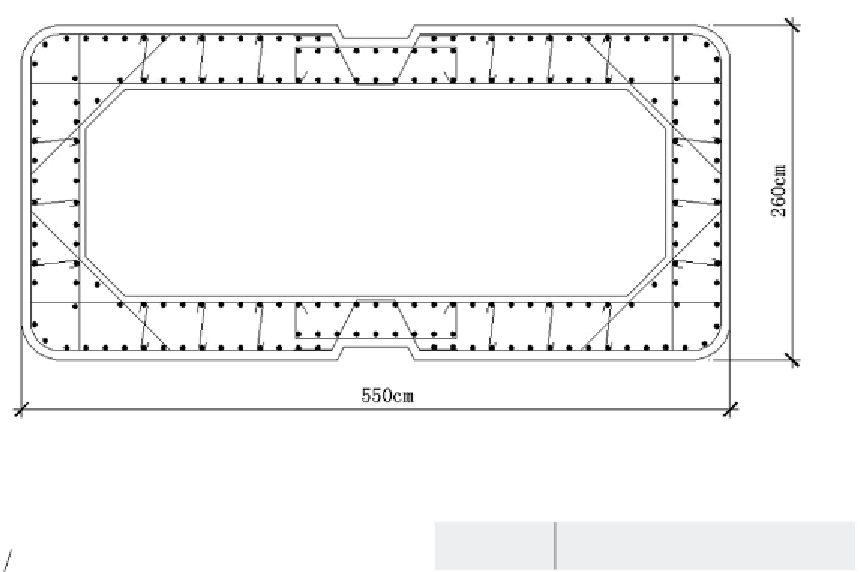
Figure 22. Section of single-column pier
Table 12. Typical single-column piers
(
)
(
(
)
)
(3)
'
ε
=
ε
1
+
5 2
.
C
0 9899
.
+
0 2204
.
RI
u
c
i
Pier model
Concentrated load at the
top of pier (×10
3
kN)
Height of pier
(m)
ε
ε
(
)
(4)
=
1 8847
.
+
0 121
.
RI
0 85
.
u
u
M1
30
10
M2
30
15
M3
30
20
Seismic Capacity of Section
Reinforced with SFRC
M4
30
25
To study the seismic capacity of a section reinforce
with SFRC, a series of finite element models are
established for some typical single-column piers
reinforced with SFRC and for some alternative
piers with plain confined concrete (CRC), whose
section is shown in Figure 22 and design param-
eters are shown in Table 12 for the pier model M1,
M2, M3 and M4. The longitudinal reinforcement
ratio is 2.2% and the lateral reinforcement ratio is
0.8% for these piers. For the SFRC, the yielding
stress and strain are 50 MPa and 6.188×10
-3
and
the ultimate stress and strain are 42.5 MPa and
13.88×10
-3
. The yielding stress and strain are 38
MPa and 3.730×10
-3
and the ultimate stress and
strain are 32.3 MPa and 7.030×10
-3
for the CRC.
For these typical single-column pier models,
M1, M2, M3 and M4 reinforced with SFRC and
CRC, pushover analyses are conducted for them
respectively. Then the capacity curve comparisons
are shown in Figure 23 and the curvature ductil-
ity comparisons are shown in Table 13. It can be
seen that the bending strength is improved if the
SFRC replaces the CRC for all the piers. It is also
shown in Table 13 that the curvature ductility of
sections adopting SFRC is better than those adopt-
ing CRC. The comparisons between the results
in Table 13 and the ones in Figure 23 show that
the improvement extent of the ductility is much
higher than that of the bending strength after
adopting the SFRC, which indicates that it's a


Search WWH ::

Custom Search