Geology Reference
In-Depth Information
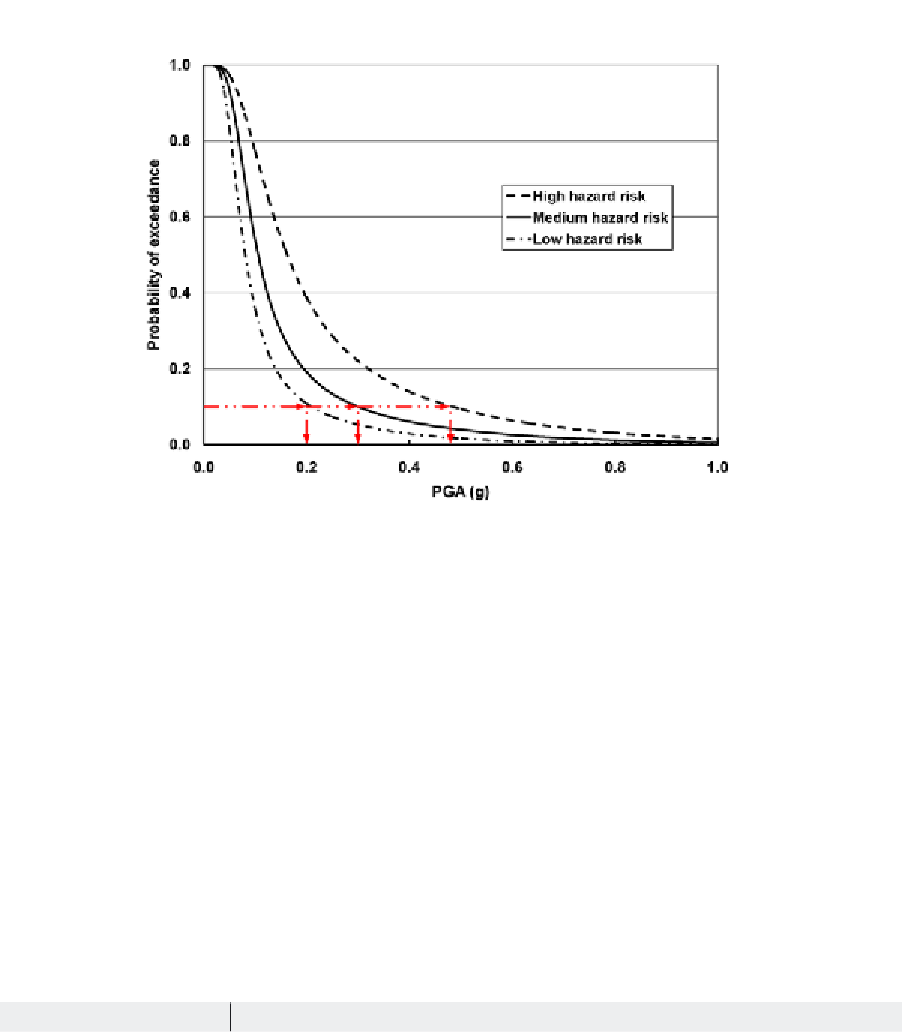
Figure 13. Seismic hazard curves for three different locations in the Los Angeles area (USGS)
where
t
f
is the duration of repair activity and
b
f
is
the usage disruption parameter due to the seismic
damage (0 ≤
b
f
≤ 1). These two parameters depend
on the state of damage,
d
k
, and the values assigned
to them are summarized in Table 8.
The summation of failure cost and its associ-
ated user cost is calculated for each of the bridge
cases and then the total failure cost is normalized
to the relevant initial construction cost for com-
parison purposes. There are also three assumptions
for the regular inspection and maintenance ac-
tivities, which include 1-, 2-, and 5-year time
intervals. Considering three levels of seismic
hazard risk, the ratio of total failure cost to initial
construction cost is shown in Figure 15 for all the
bridge cases. As it can be seen from this figure,
the obtained ratios have an increasing trend when
the inspection and maintenance activities are less
frequent and as a result, the bridges have become
more vulnerable to seismic events. As a case in
Table 7. Damage ratios for RC highway bridges (HAZUS-MH,2007)
Damage State
Range of Damage Ratios
Best Estimate Damage Ratio
slight
0.01-0.03
0.03
moderate
0.02-0.15
0.08
extensive
0.10-0.40
0.25
complete
0.03-1.00
1.00*
*If the number of spans is greater than two, then the best estimate
damage ratio for complete damage is [2/(number of spans)]


Search WWH ::

Custom Search