Geology Reference
In-Depth Information
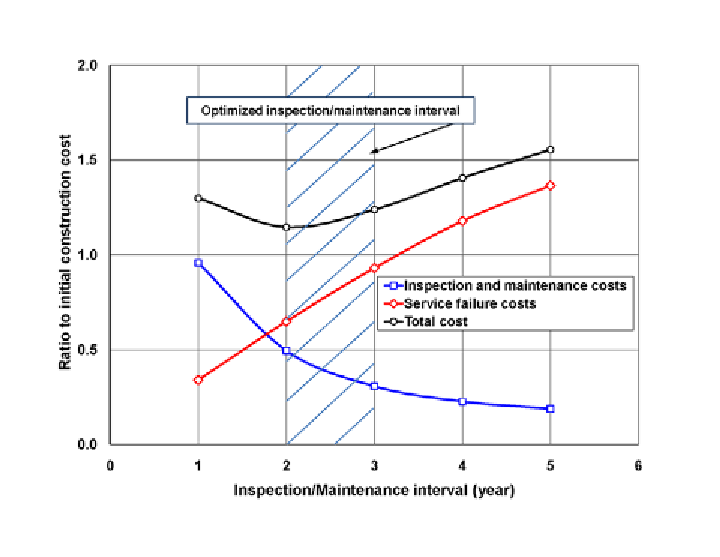
Figure 12. Total LCC of the medium-span bridge obtained for different inspection and maintenance
intervals
locations have been extracted from the USGS
database and shown in Figure 13. For the purpose
of this study, these hazard curves represent high,
medium, and low hazard risks and indicate a PGA
of 0.48, 0.32, and 0.20g for 10% probability of
exceedance in 50 years, respectively.
Using Equation 23, the performance indices
for the three levels of seismic hazard risk are
calculated in different states of damage at a range
of PGA values. The obtained results are multiplied
by damage ratios,
r
k
, which are employed as
weighting factors to adjust the economic loss due
to the different damage states. HAZUS-MH (2007)
provides some ranges for damage ratios and also
suggests the best estimates within each range for
the slight, moderate, extensive, and complete
damage states (Table 7). By repeating the explained
procedure for all time steps, the earthquake in-
duced failure cost is estimated from Equation 22.
The required steps for this procedure have also
been schematically illustrated in Figure 14.
In addition to the failure cost which is di-
rectly related to the repair and replacement costs
of a bridge, there are user costs associated with
the closure of part or whole of a bridge to traffic
after an earthquake. Similar to the user cost of the
maintenance procedure, the total user cost of the
bridge failure is calculated based on a unit user
cost,
u
, which is assumed to be identical in both
cases. By taking into account the time- and
damage-dependent performance indices obtained
from Equation 16, the total user cost of the bridge
failure,
C
e
u
, can be expressed as:
n
4
∑∑
1
(
)
( )
( )
C
u
=
PI d i
,
∆
t
t d b d u z i
(
∆
t
)
ef
k
f
k
f
k
1
i
=
k
=
(24)
Search WWH ::

Custom Search