Geology Reference
In-Depth Information
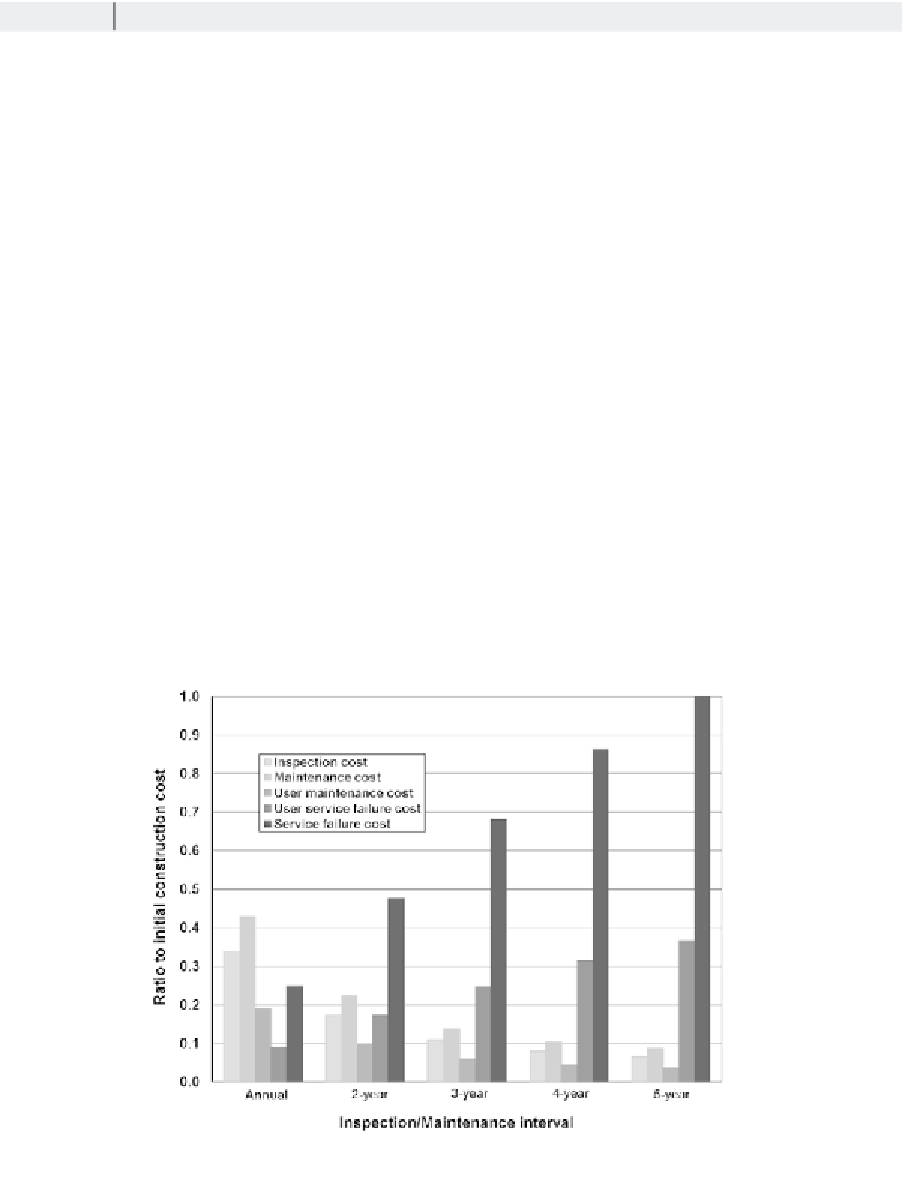
Table 6. Effects of inspection/maintenance intervals on the life cycle cost of the medium-span bridge
Interval
annual
2-year
3-year
4-year
5-year
C
c
$500,117
$500,117
$500,117
$500,117
$500,117
C
IN
$169,716
$86,887
$54,368
$39,966
$32,798
C
M
$214,288
$112,618
$69,391
$51,288
$43,249
C
M
u
$95,171
$48,723
$30,488
$22,412
$18,392
C
sf
$124,749
$237,982
$340,877
$431,840
$500,949
C
sf
u
$45,471
$86,744
$124,249
$157,405
$182,595
C
total
$1,149,512
$1,073,071
$1,119,490
$1,203,028
$1,278,100
where
P
k,i
is the probability of suffering the damage
state of
d
k
(i.e.,
DS
>
d
k
) under the ground motion
intensity (here PGA) of
x
. This probability can be
obtained at each time interval from the updated
fragility curve developed for that damage state.
On the other hand, the probability of exceeding
the ground motion intensity of
x
during the service
life-time of the bridge can be calculated from a seis-
mic hazard curve,
H
(
x
), generated for the specific
location of the bridge. For further clarification,
the current chapter demonstrates an application
of the explained approach in the calculation of
the failure cost of the case study bridges. It is
assumed that these bridges are located at three
different parts of the Los Angeles area which are
similar in terms of exposure to chloride ions but
are different in terms of the seismic hazard risk.
The seismic hazard curves corresponding to these
Figure 11. Ratio of different cost items to the initial construction cost


Search WWH ::

Custom Search