Geology Reference
In-Depth Information
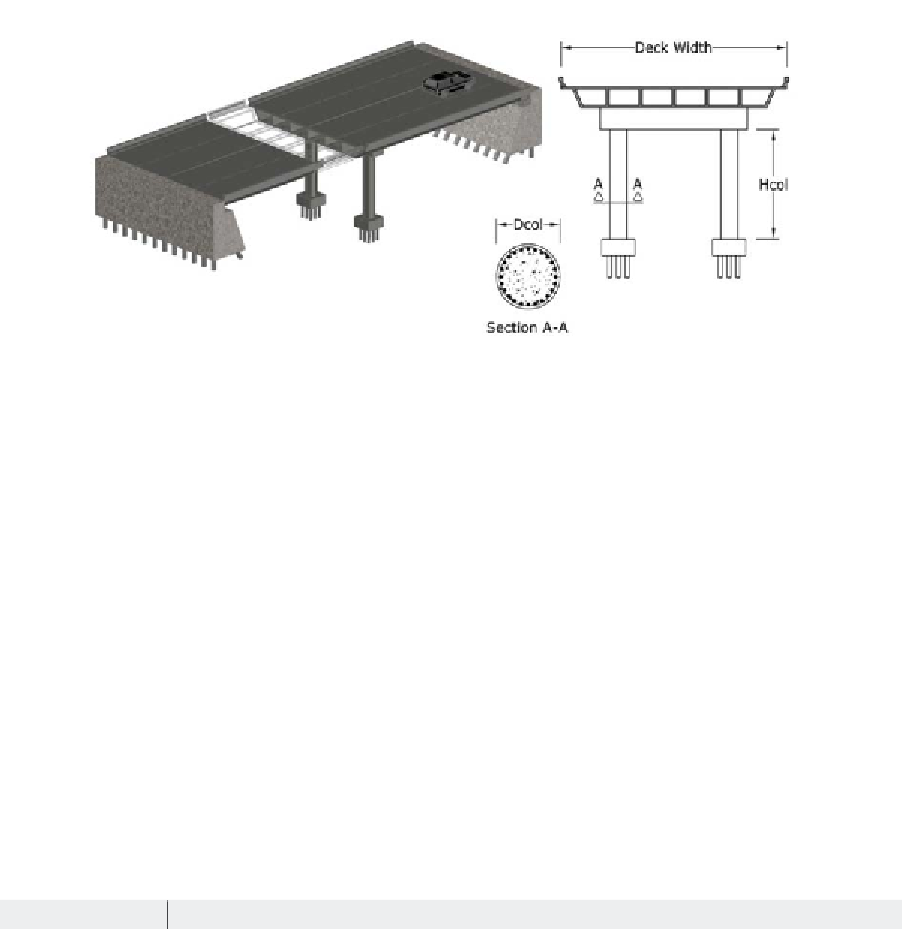
Figure 4. A schematic view of the two -span bridges under study
three sets of records corresponding to earthquakes
with 4.04×10
-4
, 2.10×10
-3
, and 1.39×10
-2
annual
frequency of exceedance, which are equivalent
to 2%, 10%, and 50% probability of occurrence
in 50 years. Figure 5 shows the spectral accelera-
tion values over a range of natural periods for the
three categories mentioned. For each category of
records, the median spectral acceleration has also
been indicated which represents the expected level
of seismic demand.
Using the selected suite of ground motions,
the dynamic response of the bridge cases are
evaluated. A series of 60 nonlinear time-history
analysis is performed for each bridge case and
response time-histories are recorded as forces and
displacements at various bridge components. For
the sake of brevity, the current study demonstrates
the seismic response only in terms of deck drift
ratio which is one of reliable response measures
among diverse response parameters. The deck
drift ratio (DDR) is defined as the relative dis-
placement of deck centroid divided by the column
height. This ratio is calculated in both longitudi-
nal and transverse directions, but since the ground
motions are applied in the longitudinal direction,
the transverse DDR can be neglected compared
to the longitudinal one. The distribution of lon-
gitudinal DDR at different time steps is shown in
Table 3. Main dimensions of the reinforced concrete bridges under study
Bridge Case No.
Number of Spans
Span Length (m)
Column Height (m)
Column Diameter (m)
1
2
15-15
7.5
1.3
2
2
15-15
10
1.3
3
2
15-15
12.5
1.3
4
2
30-30
7.5
1.6
5
2
30-30
10
1.6
6
2
30-30
12.5
1.6
7
2
45-45
7.5
1.9
8
2
45-45
10
1.9
9
2
45-45
12.5
1.9


Search WWH ::

Custom Search