Java Reference
In-Depth Information
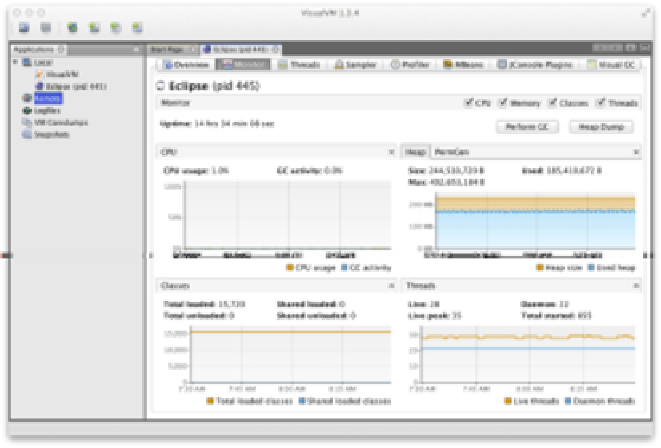
In the Monitor tab, as shown in
Figure 13-3
, graphs and data about the active parts
of the JVM system are displayed. This is essentially high-level telemetry data for the
JVM—including CPU usage and how much CPU is being used for GC.
Figure 13-3. Monitor tab
Other information displayed includes the number of classes loaded and unloaded,
basic heap memory information, and an overview of the numbers of threads
running.
From this tab, it is also possible to ask the JVM to produce a heap dump, or to per‐
form a full GC—although in normal production operation, neither are
recommended.
Figure 13-4
shows the Threads tab, which displays data on actively running threads
in the JVM. This is displayed as a continuous timeline, with the ability to inspect
individual thread details and perform thread dumps for deeper analysis.
This presents a similar view to
jstack
, but with better abilities to diagnose dead‐
locks and thread starvation. Note that the difference between
synchronized
locks
(i.e., operating system monitors) and the user-space lock objects of
java.util.con
current
can be clearly seen here.
Threads that are contending on locks backed by operating system monitors (i.e.,
synchronized blocks) will be placed into the BLOCKED state. This shows up as red
in VisualVM.