Game Development Reference
In-Depth Information
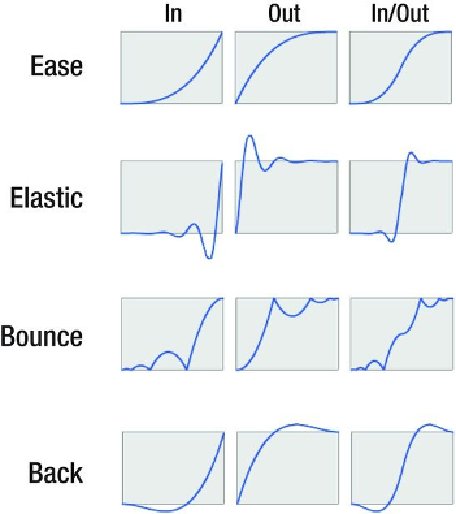
The terminology may be slightly confusing. Take, for example, the
Elastic In
easing
mode seen in
Figure 5-5
: first column; second row.
You might think that the easing is applied most near the end of the segment because that's
where the amplitude is greatest. Perhaps naturally one might assume that this is an easing
Out mode, but truly the easing starts at the beginning and gradually hones in on the target
value in ever larger amplitudes.
When in doubt, take
Figure 5-5
as a reference, though it's really easy to experiment be-
cause you can change the easing modes even while the Timeline animation is playing.
Figure 5-5
.
Easing modes illustrated
The diagrams in
Figure 5-5
illustrate how an animated property's value changes over
time. Take the
Back In/Out
easing diagram at the bottom right, for instance, and con-
sider that each horizontal side of the diagram represents a keyframe. If you were to anim-
ate, say, the rotation property between the values 100 to 200 using a
Back In/Out
eas-
ing mode, the diagram tells you that the rotation value would first fall slightly below 100
Search WWH ::

Custom Search