Biomedical Engineering Reference
In-Depth Information
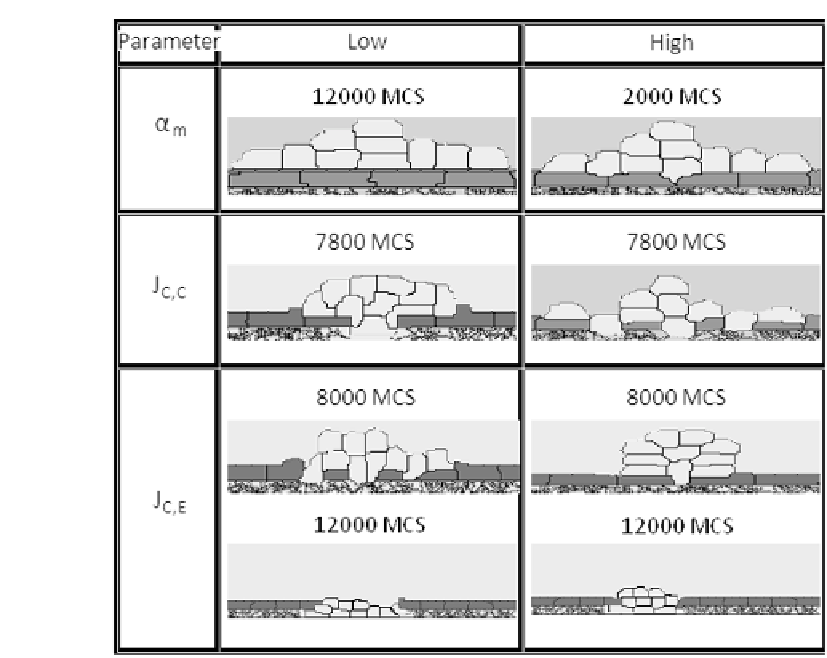
FIGURE 3.9: Summary of the simulations of multicellular spheroid invasion
run with different parameters. All the parameters not explicitly cited are given
in Tables C.3 and C.4 of Appendix C.
cadherins and by other intercellular mechanisms are instead modeled by an
initial low value of J
C;C
, which increases as the cancer aggregate starts dissem-
inating over the monolayer. The higher value of J
C;M
with respect to the case
of the single cell represents the lower overall spheroid{mesothelium adhesion
reported in the experimental literature [234]. The low expression and avid-
ity of cancer integrin subunits and the physical and geometrical constraints
limiting its ability to spread on anchoring surfaces are modeled with a slow
decrement (0.01 instead of 1 each 10 MCS) of the relative bond energy J
C;E
.
The spatial and temporal evolution of the proteases' eld are the same
as in the case of the single cell, but the total amount of the secreted MMPs
is higher (see again Table C.4) . This is due not only to the increased tumor
mass but also to the fact that cancer cells, upon acquiring a spheroid morphol-
ogy, overexpress the different types of proteases, thereby enhancing their inva-
sive potential. Finally, since experimental evidence shows that the mesothelial


Search WWH ::

Custom Search