Biomedical Engineering Reference
In-Depth Information
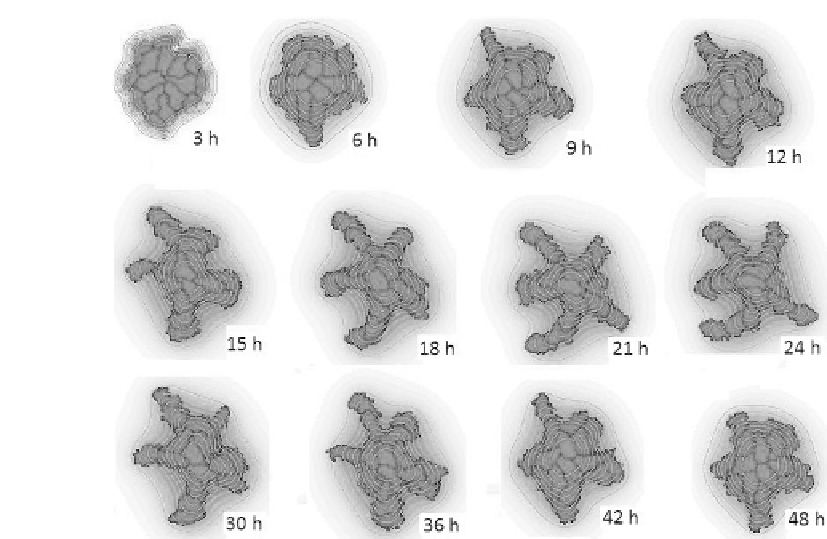
FIGURE 2.9: (See color insert.) Branching morphogenesis in a simulation
initiated with a clump of 16 MLP-29 cells. After 3000 MCS 24 h the HGF
is no longer added in the culture and regression of cell scattering is observed.
Isolines (green) indicate 10 HGF levels relative to the maximum concentration
in the simulation.
where ((
(
x
)
);C)) = 1 within cells and 0 in the extracellular environment.
D
c
is the characteristic diffusion coecient and
c
the decay rate, which are
assumed constant throughout ECM. "
c
is the uptake rate of the HGF, while
its input is set at a constant rate
c
over the entire domain.
2.5 Scattering of MLP-29 Aggregates
As in the case of the ARO model, an MCS corresponds to 30 s, while the size
of a lattice site is set equal to 2 m. In order to create a hybrid simulation
environment, the PDE for the HGF evolution is solved using a finite difference
scheme on a lattice that matches the CPM lattice, using a sucient number
of diffusion steps per MCS to guarantee the stability of the numerical method.
The reader is referred to Appendix A for more details of the computational
implementation.


Search WWH ::

Custom Search