Biomedical Engineering Reference
In-Depth Information
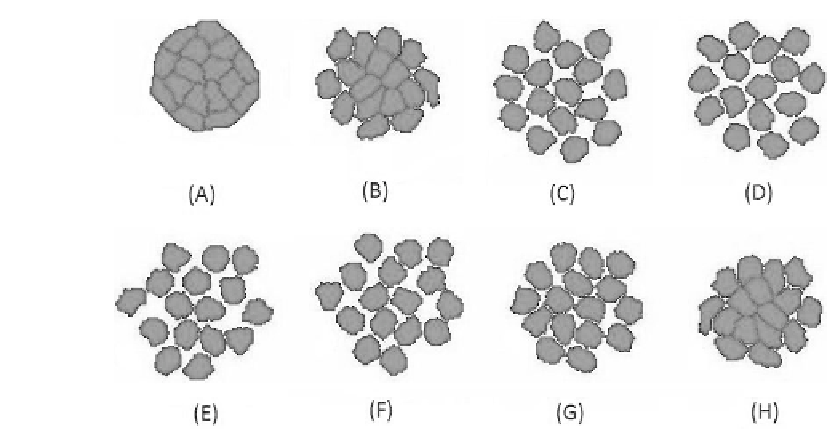
FIGURE 2.3: Cell-cell dissociation process in a simulation initiated with a
clump of 16 ARO cells: (A) 6 h, (B) 12 h, (C) 18 h, (D) 24 h, (E) 30 h, (F)
36 h, (G) 42 h, and (H) 48 hours. After 3000 MCS ( 24 hours), the HGF is
no longer added in the culture.
2.3 Scattering of ARO Aggregates
Each simulation is initiated with a mass of 16 virtual cells over an area of
300300 lattice sites, which we positioned in a larger domain of 500500
sites to minimize boundary effects. Each CPM lattice site corresponds to a
square of size 2 m 2 m. A Monte Carlo Step (MCS) corresponds to 30 s:
for this choice of timescale, the mean of the cell velocities agrees well with in
vivo observations. The initial area A
volum
C
of the simulated ARO cells is set
to 50 lattice sites, corresponding to 200 m
2
, while their perimeter A
perimeter
C
to 48, i.e., 96 m. Assuming that the HGF has already been added in the
culture, and following the hypothesis made in the previous section, we first
use high values for the motility parameter T and for J
C;C
J
C;M
; see Table
C.1 in Appendix C.
Figure 2.3(A-D) shows a typical simulation of the time-sequence evolution
of a culture of ARO cells in the presence of HGF. After an initial roughening,
the cells start to detach and to radially spread in close proximity, keeping an
almost elliptical shape. In Figure 2.3(E-H), we also simulate the loss of HGF
in the culture medium by decreasing J
C;C
while maintaining the other param-
eters fixed: as in the experiments, the cells aggregate again in an closely ad-
joined island, confirming the hypothesis of the recovered E-cadherin signaling.


Search WWH ::

Custom Search