Biomedical Engineering Reference
In-Depth Information
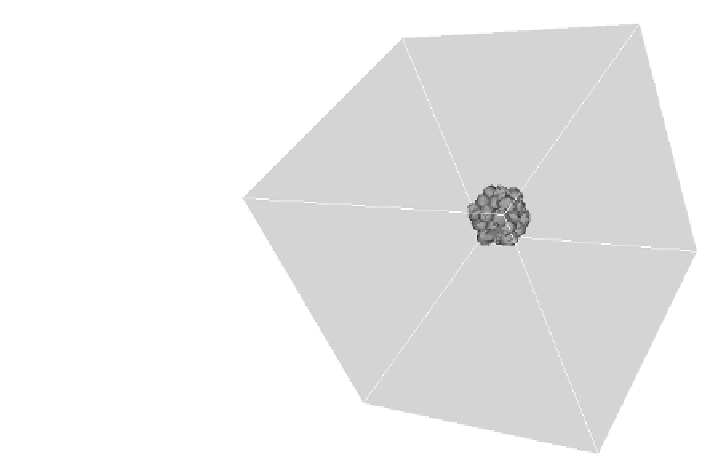
FIGURE 8.12: Initial condition (i.e., at t = 0) of the tumor mass for all sets
of simulations. We start with a cluster of 24 cells placed in the center of the
lattice. The dimensions of cells, as well as all the other model parameters, are
given in Table C.9.
The boundary conditions for the proteolytic enzymes, m, are zero flux
at the border of the entire domain (i.e., n
@
x
rm(@x 2 @;t) = 0, where
n
@
x
is the outward normal to @x), assuming that these parts of the tissue
are far enough from the cancer mass. The borders of the domain represent
instead an extended source for the environmental growth factors, which are
supposed to be supplied by the host: consequently, we set n(@x 2 @;t) =
n
.
The intracellular basal level of chemical factors, n
0
, and its threshold for the
necrotic transition have been experimentally measured for glioma spheroids
grown from glioblastoma multiforme (GBM) cells [29, 67, 138]. The extracellu-
lar environment is initially seeded with a low level of growth factors n
ext;0
, and
with a saturating level of ECM, p
ext;0
. Finally, there are no secreted MMPs
in the extracellular medium at the beginning of the simulations.
To quantify the effects of the different model parameters on the tumor
phenotype, we concentrate on the evolution of invasive depth of the mass,
defined as d(t) and measured as the radius of the sphere circumscribing the
95% of malignant cells. This choice is done to avoid biases toward accounting
for few shed individuals. d has a clear clinical relevance, since it quantitatively
estimates the severity of the disease and characterizes the presence of a signif-
icant number of metastasis delocalized with respect to the main body of the
tumor.
We first simulate the growth of the tumor in the standard parameter set-


Search WWH ::

Custom Search