Biomedical Engineering Reference
In-Depth Information
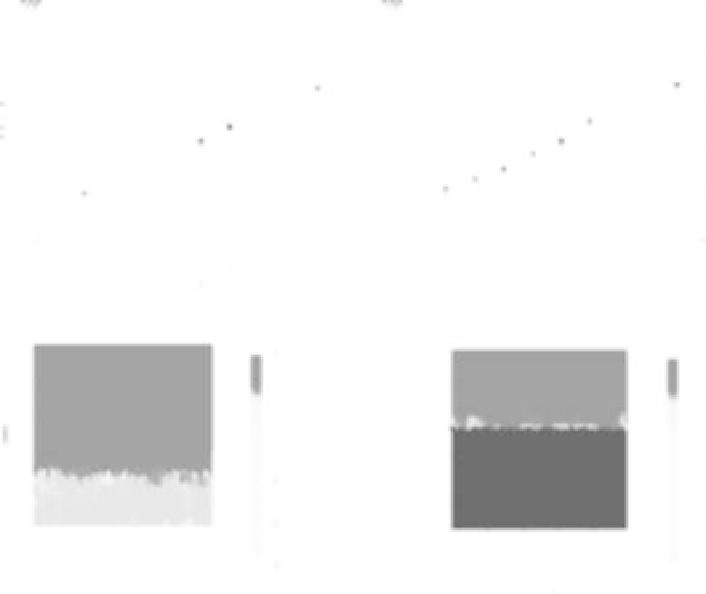
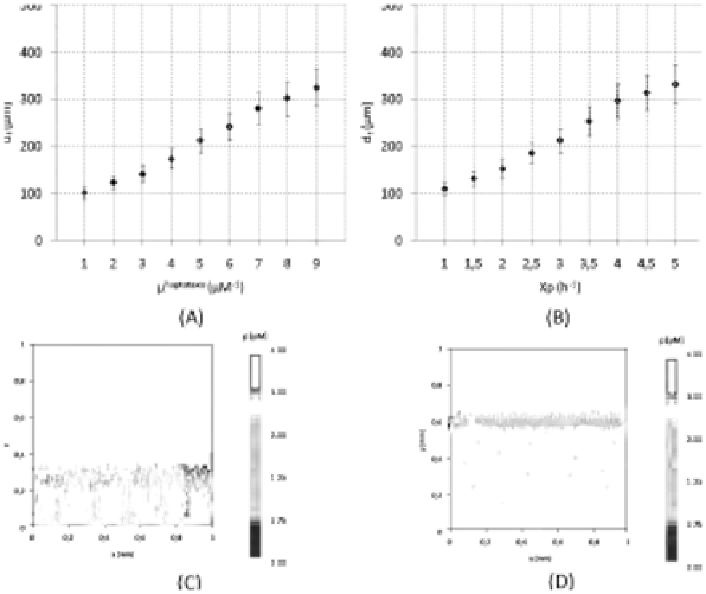
FIGURE 8.8: (See color insert.) Invasiveness of the tumor mass in response
to alterations in the interactions between malignant cells and ECM substrate.
(A) Final depth of invasion df
f
vs haptotactic coecient
hapt
(all the other
model parameters are the same as in the simulation in Figure 8.4), error bars
show standard deviation over 10 realizations. Inhibitions of cell sensitivity
translate in decrements of the aggressiveness of the lesion. (B) Final depth
of invasion df
f
vs. degradation rate of ECM proteins
p
(all the other model
parameters are the same as in the simulation in Figure 8.4): The error bars
show standard deviation over 10 realizations. A downregulation of the activity
of tumor MMPs results in a more homogeneous pattern of protein distribution:
therefore malignant individuals have not a directional path to follow during
their motion. Final pattern of ECM protein concentration for (C)
p
= 1
and (D)
p
= 5. In the last images, we do not explicitly represent the cell
configuration: however the invasive depth of the shed malignant individuals
is easily recognized by looking the interface between the zones with partially
degraded matrix components and those with the initial amount of substrate.
aggressiveness). High values of
p
result instead in a dramatic digestion of the
matrix substrate and in the consequent formation of steep gradients, as repro-
duced in Figure 8.8(D), which enhance the directional movement of malignant


Search WWH ::

Custom Search