Biomedical Engineering Reference
In-Depth Information
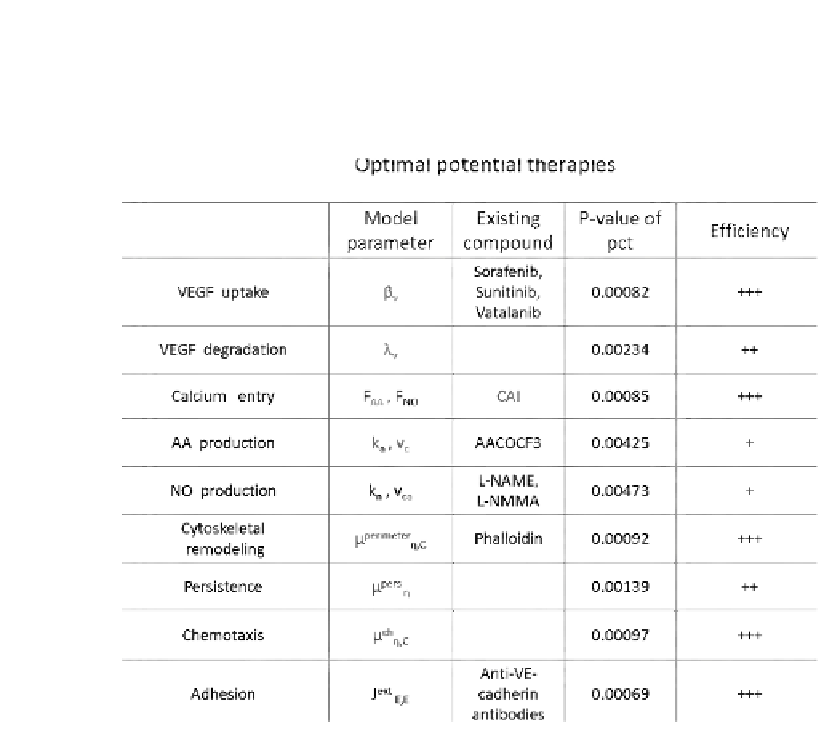
FIGURE 7.15: Optimal potential anti-angiogenic therapies found by model
disruptions. Table shows the proposed therapies with their relative modified
parameters and, whenever currently available, the existing experimental drugs.
Forth column of the table gives a statitistical test for each intervention: the
percentage of reduction of the total tubule length (pct) has been evaluated
with a one-sided eq
ual
-variance t-test with a Bonf
err
oni correcti
on,
which
tests the hypothesis pct > 0 against the alternative pct = 0, where pct is the
mean over 20 simulations of pct, with a level of significance P < 0.005 [333].
In particular, for P < 0.001 we have an optimal solution (labeled with +++
in the table), for 0.001 < P < 0.003 we have a suboptimal solution, ++, while
for 0.003 < P < 0.005 we have a bad solution, +.


Search WWH ::

Custom Search