Biomedical Engineering Reference
In-Depth Information
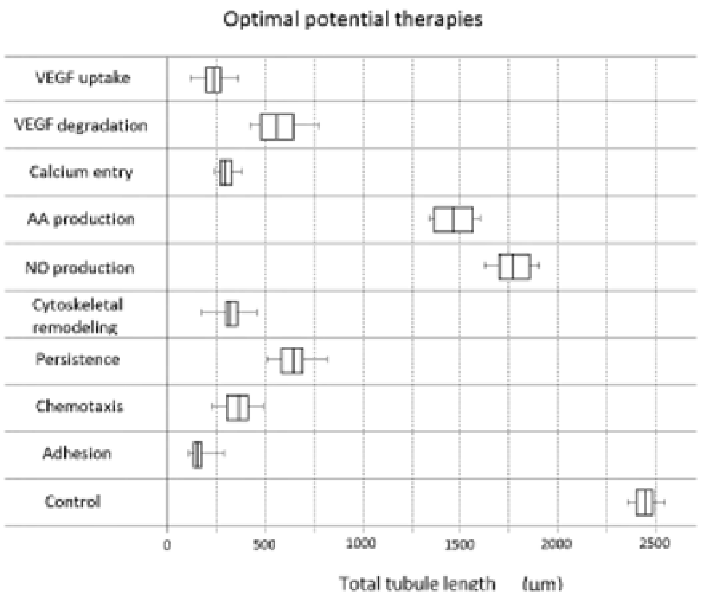
FIGURE 7.14: Optimal potential anti-angiogenic therapies found by model
disruptions (control solution represents the no treatment case, with no changes
in the parameter, and corresponds to simulation of Figure 7.3). Box plot of the
total tubule length (in m), with 20 simulations for each simulated strategy.


Search WWH ::

Custom Search